
Introductory Statistics (2nd Edition)
2nd Edition
ISBN: 9780321978271
Author: Robert Gould, Colleen N. Ryan
Publisher: PEARSON
expand_more
expand_more
format_list_bulleted
Concept explainers
Videos
Textbook Question
Chapter 3, Problem 60SE
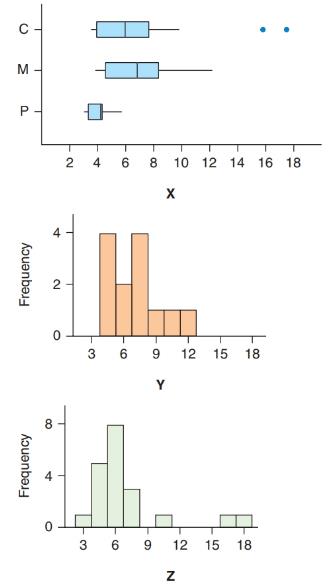
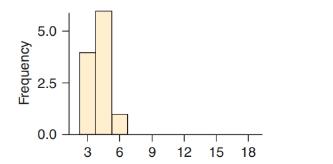
Matching Boxplots and Histograms Match each of the histograms (X, Y, and Z) with the corresponding boxplot (C, M, or P). Explain your reasoning.
Expert Solution & Answer
Want to see the full answer?
Check out a sample textbook solution
Students have asked these similar questions
Une Entreprise œuvrant dans le domaine du multividéo donne l'opportunité à ses
programmeurs-analystes d'évaluer la performance des cadres supérieurs.
Voici les résultats obtenues (sur une échelle de 10 à 50) où 50 représentent une
excellente performance. 10 programmeurs furent sélectionnés au hazard pour
évaluer deux cadres. Un rapport Excel est également fourni.
Programmeurs
Cadre A Cadre B
1
34
36
2
32
34
3
18
19
33
38
19
21
21
23
7
35
34
8
20
20
9
34
34
10
36
34
Test d'égalité des espérances: observations pairées
A television news channel samples 25 gas stations from its local area and uses the results to estimate the average gas price for the state. What’s wrong with its margin of error?
You’re fed up with keeping Fido locked inside, so you conduct a mail survey to find out people’s opinions on the new dog barking ordinance in a certain city. Of the 10,000 people who receive surveys, 1,000 respond, and only 80 are in favor of it. You calculate the margin of error to be 1.2 percent. Explain why this reported margin of error is misleading.
Chapter 3 Solutions
Introductory Statistics (2nd Edition)
Ch. 3 - Earnings A sociologist says, “Typically, men in...Ch. 3 - Houses A real estate agent claims that all things...Ch. 3 - Age of CEOs (Example) the histogram shows the ages...Ch. 3 - Televisions The histogram shows the number of...Ch. 3 - Billionaires According to Forbes.com, the numbers...Ch. 3 - Billionaires According to Forbes.com, the numbers...Ch. 3 - Paid Vacation Days (Example 2) This list...Ch. 3 - Children of First Ladies This list represents the...Ch. 3 - Ages of Presidents at Inauguration At their...Ch. 3 - Ages of Chief Justices at Installation At their...
Ch. 3 - Weight Loss (Example 3) The table shows Minitab...Ch. 3 - Education of Father and Mother The table shows...Ch. 3 - Surfing College students and surfers Rex Robinson...Ch. 3 - Eating Out College student Jacqueline Loya asked a...Ch. 3 - Real state price (Example) look at the two...Ch. 3 - Dice The histogram contain data with a range of 1...Ch. 3 - Birth Weights (Example 5) The mean birth weigh for...Ch. 3 - Birth Length The mean birth length for U.S....Ch. 3 - Children’s Ages (Example 6) Mrs. Johnson’s...Ch. 3 - Pay Rate in Different Currencies The pay rates for...Ch. 3 - Olympics In the most recent summer Olympics, do...Ch. 3 - Weights Suppose you have a data set with the...Ch. 3 - Brain Size The brain size (in hundreds of...Ch. 3 - Happiness A survey on StatCrunch asked people to...Ch. 3 - Drinkers The number of alcoholic drinks per week...Ch. 3 - Prob. 26SECh. 3 - Violent Crime: West (Example 7) In 2011, the mean...Ch. 3 - Violent Crime: East In 2011, the mean rate of...Ch. 3 - Property Crime (Example 8) In 2011, the mean...Ch. 3 - Property Crime In 2011, the mean property crime...Ch. 3 - Heights and z-Scores The dotplot shows heights of...Ch. 3 - Heights Refer to the dotplot in the previous...Ch. 3 - Unusual IQs (Example 9) Wechsler IQ tests have a...Ch. 3 - Lengths of Pregnancy Distributions of gestation...Ch. 3 - Low-Birth-Weight Babies (Example 10) Babies born...Ch. 3 - Birth Lengths Babies born after 40 weeks gestation...Ch. 3 - Women's Heights Assume that women's heights have a...Ch. 3 - SATs The quantitative portion of the SAT exam has...Ch. 3 - Name two measures of the center of a distribution,...Ch. 3 - Name two measures of the variation of a...Ch. 3 - Pixar Animated Movies (Example 11) The ten...Ch. 3 - DreamWorks Animated Movies The ten top-grossing...Ch. 3 - Pixar Animated Movies Again (Example 12) Find the...Ch. 3 - Dreamworks Animated Movies Find the median and...Ch. 3 - Prob. 45SECh. 3 - Drinks The number of alcoholic drinks per week is...Ch. 3 - Outliers a. In your own words, describe to someone...Ch. 3 - Center and Variation When you are comparing two...Ch. 3 - An Error A dieter recorded the number of calories...Ch. 3 - Baseball Strike In 1994, Major League Baseball...Ch. 3 - Heads The graphs show the circumferences of heads...Ch. 3 - House Prices The graphs show the house prices (in...Ch. 3 - Shoes (Example 14) The histograms show the number...Ch. 3 - Tax Rate A StatCrunch survey asked people what...Ch. 3 - Regional Population Density The figure shows the...Ch. 3 - Property Crime Rates The boxplot shows the...Ch. 3 - City Temperatures The boxplot shows temperatures...Ch. 3 - Brain Size The boxplots show the brain size (in...Ch. 3 - Matching Boxplots and Histograms a. Report the...Ch. 3 - Matching Boxplots and Histograms Match each of the...Ch. 3 - Sleep Time of Animals Data at this text's website...Ch. 3 - BA Percentage The data show the percentage of...Ch. 3 - Tall Buildings The dotplot shows the distribution...Ch. 3 - Passing the Bar Exam The dotplot shows the...Ch. 3 - Exam Scores The five-number summary for a...Ch. 3 - Exam Scores The five-number summary for a...Ch. 3 - Death Row: South (Example 15) The table shows the...Ch. 3 - Death Row: West The table shows the numbers of...Ch. 3 - Head Circumference (Example 16) Following are head...Ch. 3 - Heights of Sons and Dads The data at this text’s...Ch. 3 - Final Exam Grades The data that follow are final...Ch. 3 - Speeding Tickets College students Diane Glover and...Ch. 3 - Heights The following graph shows the heights for...Ch. 3 - Marathon Times The following histogram of marathon...Ch. 3 - Soda Consumption A StatCrunch survey asked people...Ch. 3 - Holiday Spending A StatCrunch survey asked people...Ch. 3 - a. State an approximate value for the mean height...Ch. 3 - Ideal Family In 2012, the General Social Survey...Ch. 3 - For exercises 3.85 through 3.88, construct two...Ch. 3 - For exercises 3.85 through 3.88, construct two...Ch. 3 - For exercises 3.85 through 3.88, construct two...Ch. 3 - 3.79-3.82 construct two sets of numbers with at...Ch. 3 - Population Density Data were recorded for each of...Ch. 3 - Population Increase Data were recorded for each of...Ch. 3 - Prob. 85CRECh. 3 - Eating Out, Again College student Jacqueline Loya...Ch. 3 - Study Hours A group of 50 statistics students, 25...Ch. 3 - Driving Accidents College student Sandy Hudson...Ch. 3 - Exam Scores An exam has a mean of 70 and a...Ch. 3 - Boys’ Heights Three-year-old boys in the United...Ch. 3 - SAT and ACT Scores Quantitative SAT scores have a...Ch. 3 - Children’s Heights Mrs. Diaz has two children: a...Ch. 3 - Students’ Ages Here are the ages of some students...Ch. 3 - House Prices The figure, which is from data taken...
Additional Math Textbook Solutions
Find more solutions based on key concepts
For Problems 23-28, write in simpler form, as in Example 4. logbFG
Finite Mathematics for Business, Economics, Life Sciences and Social Sciences
First Derivative Test a. Locale the critical points of f. b. Use the First Derivative Test to locale the local ...
Calculus: Early Transcendentals (2nd Edition)
23. A plant nursery sells two sizes of oak trees to landscapers. Large trees cost the nursery $120 from the gro...
College Algebra (Collegiate Math)
(a) Make a stem-and-leaf plot for these 24 observations on the number of customers who used a down-town CitiBan...
APPLIED STAT.IN BUS.+ECONOMICS
147. Draining a tank Water drains from the conical tank shown in the accompanying figure at the rate .
a. What...
University Calculus
CHECK POINT I Consider the six jokes about books by Groucho Marx. Bob Blitzer. Steven Wright, HennyYoungman. Je...
Thinking Mathematically (6th Edition)
Knowledge Booster


Learn more about
Need a deep-dive on the concept behind this application? Look no further. Learn more about this topic, statistics and related others by exploring similar questions and additional content below.Similar questions
- You find out that the dietary scale you use each day is off by a factor of 2 ounces (over — at least that’s what you say!). The margin of error for your scale was plus or minus 0.5 ounces before you found this out. What’s the margin of error now?arrow_forwardSuppose that Sue and Bill each make a confidence interval out of the same data set, but Sue wants a confidence level of 80 percent compared to Bill’s 90 percent. How do their margins of error compare?arrow_forwardSuppose that you conduct a study twice, and the second time you use four times as many people as you did the first time. How does the change affect your margin of error? (Assume the other components remain constant.)arrow_forward
- Out of a sample of 200 babysitters, 70 percent are girls, and 30 percent are guys. What’s the margin of error for the percentage of female babysitters? Assume 95 percent confidence.What’s the margin of error for the percentage of male babysitters? Assume 95 percent confidence.arrow_forwardYou sample 100 fish in Pond A at the fish hatchery and find that they average 5.5 inches with a standard deviation of 1 inch. Your sample of 100 fish from Pond B has the same mean, but the standard deviation is 2 inches. How do the margins of error compare? (Assume the confidence levels are the same.)arrow_forwardA survey of 1,000 dental patients produces 450 people who floss their teeth adequately. What’s the margin of error for this result? Assume 90 percent confidence.arrow_forward
- The annual aggregate claim amount of an insurer follows a compound Poisson distribution with parameter 1,000. Individual claim amounts follow a Gamma distribution with shape parameter a = 750 and rate parameter λ = 0.25. 1. Generate 20,000 simulated aggregate claim values for the insurer, using a random number generator seed of 955.Display the first five simulated claim values in your answer script using the R function head(). 2. Plot the empirical density function of the simulated aggregate claim values from Question 1, setting the x-axis range from 2,600,000 to 3,300,000 and the y-axis range from 0 to 0.0000045. 3. Suggest a suitable distribution, including its parameters, that approximates the simulated aggregate claim values from Question 1. 4. Generate 20,000 values from your suggested distribution in Question 3 using a random number generator seed of 955. Use the R function head() to display the first five generated values in your answer script. 5. Plot the empirical density…arrow_forwardFind binomial probability if: x = 8, n = 10, p = 0.7 x= 3, n=5, p = 0.3 x = 4, n=7, p = 0.6 Quality Control: A factory produces light bulbs with a 2% defect rate. If a random sample of 20 bulbs is tested, what is the probability that exactly 2 bulbs are defective? (hint: p=2% or 0.02; x =2, n=20; use the same logic for the following problems) Marketing Campaign: A marketing company sends out 1,000 promotional emails. The probability of any email being opened is 0.15. What is the probability that exactly 150 emails will be opened? (hint: total emails or n=1000, x =150) Customer Satisfaction: A survey shows that 70% of customers are satisfied with a new product. Out of 10 randomly selected customers, what is the probability that at least 8 are satisfied? (hint: One of the keyword in this question is “at least 8”, it is not “exactly 8”, the correct formula for this should be = 1- (binom.dist(7, 10, 0.7, TRUE)). The part in the princess will give you the probability of seven and less than…arrow_forwardplease answer these questionsarrow_forward
- Selon une économiste d’une société financière, les dépenses moyennes pour « meubles et appareils de maison » ont été moins importantes pour les ménages de la région de Montréal, que celles de la région de Québec. Un échantillon aléatoire de 14 ménages pour la région de Montréal et de 16 ménages pour la région Québec est tiré et donne les données suivantes, en ce qui a trait aux dépenses pour ce secteur d’activité économique. On suppose que les données de chaque population sont distribuées selon une loi normale. Nous sommes intéressé à connaitre si les variances des populations sont égales.a) Faites le test d’hypothèse sur deux variances approprié au seuil de signification de 1 %. Inclure les informations suivantes : i. Hypothèse / Identification des populationsii. Valeur(s) critique(s) de Fiii. Règle de décisioniv. Valeur du rapport Fv. Décision et conclusion b) A partir des résultats obtenus en a), est-ce que l’hypothèse d’égalité des variances pour cette…arrow_forwardAccording to an economist from a financial company, the average expenditures on "furniture and household appliances" have been lower for households in the Montreal area than those in the Quebec region. A random sample of 14 households from the Montreal region and 16 households from the Quebec region was taken, providing the following data regarding expenditures in this economic sector. It is assumed that the data from each population are distributed normally. We are interested in knowing if the variances of the populations are equal. a) Perform the appropriate hypothesis test on two variances at a significance level of 1%. Include the following information: i. Hypothesis / Identification of populations ii. Critical F-value(s) iii. Decision rule iv. F-ratio value v. Decision and conclusion b) Based on the results obtained in a), is the hypothesis of equal variances for this socio-economic characteristic measured in these two populations upheld? c) Based on the results obtained in a),…arrow_forwardA major company in the Montreal area, offering a range of engineering services from project preparation to construction execution, and industrial project management, wants to ensure that the individuals who are responsible for project cost estimation and bid preparation demonstrate a certain uniformity in their estimates. The head of civil engineering and municipal services decided to structure an experimental plan to detect if there could be significant differences in project evaluation. Seven projects were selected, each of which had to be evaluated by each of the two estimators, with the order of the projects submitted being random. The obtained estimates are presented in the table below. a) Complete the table above by calculating: i. The differences (A-B) ii. The sum of the differences iii. The mean of the differences iv. The standard deviation of the differences b) What is the value of the t-statistic? c) What is the critical t-value for this test at a significance level of 1%?…arrow_forward
arrow_back_ios
SEE MORE QUESTIONS
arrow_forward_ios
Recommended textbooks for you
 Holt Mcdougal Larson Pre-algebra: Student Edition...AlgebraISBN:9780547587776Author:HOLT MCDOUGALPublisher:HOLT MCDOUGAL
 Glencoe Algebra 1, Student Edition, 9780079039897...AlgebraISBN:9780079039897Author:CarterPublisher:McGraw Hill
 Big Ideas Math A Bridge To Success Algebra 1: Stu...AlgebraISBN:9781680331141Author:HOUGHTON MIFFLIN HARCOURTPublisher:Houghton Mifflin Harcourt
 Functions and Change: A Modeling Approach to Coll...AlgebraISBN:9781337111348Author:Bruce Crauder, Benny Evans, Alan NoellPublisher:Cengage Learning
Holt Mcdougal Larson Pre-algebra: Student Edition...
Algebra
ISBN:9780547587776
Author:HOLT MCDOUGAL
Publisher:HOLT MCDOUGAL
Glencoe Algebra 1, Student Edition, 9780079039897...
Algebra
ISBN:9780079039897
Author:Carter
Publisher:McGraw Hill
Big Ideas Math A Bridge To Success Algebra 1: Stu...
Algebra
ISBN:9781680331141
Author:HOUGHTON MIFFLIN HARCOURT
Publisher:Houghton Mifflin Harcourt
Functions and Change: A Modeling Approach to Coll...
Algebra
ISBN:9781337111348
Author:Bruce Crauder, Benny Evans, Alan Noell
Publisher:Cengage Learning
Probability & Statistics (28 of 62) Basic Definitions and Symbols Summarized; Author: Michel van Biezen;https://www.youtube.com/watch?v=21V9WBJLAL8;License: Standard YouTube License, CC-BY
Introduction to Probability, Basic Overview - Sample Space, & Tree Diagrams; Author: The Organic Chemistry Tutor;https://www.youtube.com/watch?v=SkidyDQuupA;License: Standard YouTube License, CC-BY