
Introductory Statistics (2nd Edition)
2nd Edition
ISBN: 9780321978271
Author: Robert Gould, Colleen N. Ryan
Publisher: PEARSON
expand_more
expand_more
format_list_bulleted
Concept explainers
Videos
Textbook Question
Chapter 3, Problem 56SE
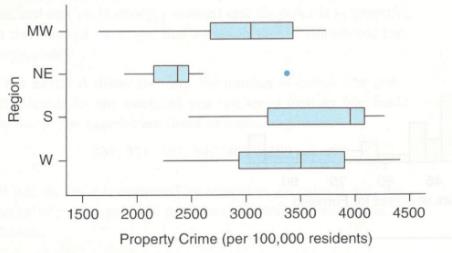
Property Crime Rates The boxplot shows the property crime rate per 100,000 residents in the 50 states. The outlier is Delaware. The regions are the Midwest (MW). Northeast (NE), South (S), and West (W).
a. List the approximate
b. List the regions from lowest to highest
c. Why is the interquartile range a better measure of the variability for these data than the range is?
Expert Solution & Answer
Want to see the full answer?
Check out a sample textbook solution
Students have asked these similar questions
T1.4: Let ẞ(G) be the minimum size of a vertex cover, a(G) be the maximum size of an
independent set and m(G) = |E(G)|.
(i) Prove that if G is triangle free (no induced K3) then m(G) ≤ a(G)B(G). Hints - The
neighborhood of a vertex in a triangle free graph must be independent; all edges have at least
one end in a vertex cover.
(ii) Show that all graphs of order n ≥ 3 and size m> [n2/4] contain a triangle. Hints - you
may need to use either elementary calculus or the arithmetic-geometric mean inequality.
We consider the one-period model studied in class as an example. Namely, we assumethat the current stock price is S0 = 10. At time T, the stock has either moved up toSt = 12 (with probability p = 0.6) or down towards St = 8 (with probability 1−p = 0.4).We consider a call option on this stock with maturity T and strike price K = 10. Theinterest rate on the money market is zero.As in class, we assume that you, as a customer, are willing to buy the call option on100 shares of stock for $120. The investor, who sold you the option, can adopt one of thefollowing strategies: Strategy 1: (seen in class) Buy 50 shares of stock and borrow $380. Strategy 2: Buy 55 shares of stock and borrow $430. Strategy 3: Buy 60 shares of stock and borrow $480. Strategy 4: Buy 40 shares of stock and borrow $280.(a) For each of strategies 2-4, describe the value of the investor’s portfolio at time 0,and at time T for each possible movement of the stock.(b) For each of strategies 2-4, does the investor have…
Negate the following compound statement using De Morgans's laws.
Chapter 3 Solutions
Introductory Statistics (2nd Edition)
Ch. 3 - Earnings A sociologist says, “Typically, men in...Ch. 3 - Houses A real estate agent claims that all things...Ch. 3 - Age of CEOs (Example) the histogram shows the ages...Ch. 3 - Televisions The histogram shows the number of...Ch. 3 - Billionaires According to Forbes.com, the numbers...Ch. 3 - Billionaires According to Forbes.com, the numbers...Ch. 3 - Paid Vacation Days (Example 2) This list...Ch. 3 - Children of First Ladies This list represents the...Ch. 3 - Ages of Presidents at Inauguration At their...Ch. 3 - Ages of Chief Justices at Installation At their...
Ch. 3 - Weight Loss (Example 3) The table shows Minitab...Ch. 3 - Education of Father and Mother The table shows...Ch. 3 - Surfing College students and surfers Rex Robinson...Ch. 3 - Eating Out College student Jacqueline Loya asked a...Ch. 3 - Real state price (Example) look at the two...Ch. 3 - Dice The histogram contain data with a range of 1...Ch. 3 - Birth Weights (Example 5) The mean birth weigh for...Ch. 3 - Birth Length The mean birth length for U.S....Ch. 3 - Children’s Ages (Example 6) Mrs. Johnson’s...Ch. 3 - Pay Rate in Different Currencies The pay rates for...Ch. 3 - Olympics In the most recent summer Olympics, do...Ch. 3 - Weights Suppose you have a data set with the...Ch. 3 - Brain Size The brain size (in hundreds of...Ch. 3 - Happiness A survey on StatCrunch asked people to...Ch. 3 - Drinkers The number of alcoholic drinks per week...Ch. 3 - Prob. 26SECh. 3 - Violent Crime: West (Example 7) In 2011, the mean...Ch. 3 - Violent Crime: East In 2011, the mean rate of...Ch. 3 - Property Crime (Example 8) In 2011, the mean...Ch. 3 - Property Crime In 2011, the mean property crime...Ch. 3 - Heights and z-Scores The dotplot shows heights of...Ch. 3 - Heights Refer to the dotplot in the previous...Ch. 3 - Unusual IQs (Example 9) Wechsler IQ tests have a...Ch. 3 - Lengths of Pregnancy Distributions of gestation...Ch. 3 - Low-Birth-Weight Babies (Example 10) Babies born...Ch. 3 - Birth Lengths Babies born after 40 weeks gestation...Ch. 3 - Women's Heights Assume that women's heights have a...Ch. 3 - SATs The quantitative portion of the SAT exam has...Ch. 3 - Name two measures of the center of a distribution,...Ch. 3 - Name two measures of the variation of a...Ch. 3 - Pixar Animated Movies (Example 11) The ten...Ch. 3 - DreamWorks Animated Movies The ten top-grossing...Ch. 3 - Pixar Animated Movies Again (Example 12) Find the...Ch. 3 - Dreamworks Animated Movies Find the median and...Ch. 3 - Prob. 45SECh. 3 - Drinks The number of alcoholic drinks per week is...Ch. 3 - Outliers a. In your own words, describe to someone...Ch. 3 - Center and Variation When you are comparing two...Ch. 3 - An Error A dieter recorded the number of calories...Ch. 3 - Baseball Strike In 1994, Major League Baseball...Ch. 3 - Heads The graphs show the circumferences of heads...Ch. 3 - House Prices The graphs show the house prices (in...Ch. 3 - Shoes (Example 14) The histograms show the number...Ch. 3 - Tax Rate A StatCrunch survey asked people what...Ch. 3 - Regional Population Density The figure shows the...Ch. 3 - Property Crime Rates The boxplot shows the...Ch. 3 - City Temperatures The boxplot shows temperatures...Ch. 3 - Brain Size The boxplots show the brain size (in...Ch. 3 - Matching Boxplots and Histograms a. Report the...Ch. 3 - Matching Boxplots and Histograms Match each of the...Ch. 3 - Sleep Time of Animals Data at this text's website...Ch. 3 - BA Percentage The data show the percentage of...Ch. 3 - Tall Buildings The dotplot shows the distribution...Ch. 3 - Passing the Bar Exam The dotplot shows the...Ch. 3 - Exam Scores The five-number summary for a...Ch. 3 - Exam Scores The five-number summary for a...Ch. 3 - Death Row: South (Example 15) The table shows the...Ch. 3 - Death Row: West The table shows the numbers of...Ch. 3 - Head Circumference (Example 16) Following are head...Ch. 3 - Heights of Sons and Dads The data at this text’s...Ch. 3 - Final Exam Grades The data that follow are final...Ch. 3 - Speeding Tickets College students Diane Glover and...Ch. 3 - Heights The following graph shows the heights for...Ch. 3 - Marathon Times The following histogram of marathon...Ch. 3 - Soda Consumption A StatCrunch survey asked people...Ch. 3 - Holiday Spending A StatCrunch survey asked people...Ch. 3 - a. State an approximate value for the mean height...Ch. 3 - Ideal Family In 2012, the General Social Survey...Ch. 3 - For exercises 3.85 through 3.88, construct two...Ch. 3 - For exercises 3.85 through 3.88, construct two...Ch. 3 - For exercises 3.85 through 3.88, construct two...Ch. 3 - 3.79-3.82 construct two sets of numbers with at...Ch. 3 - Population Density Data were recorded for each of...Ch. 3 - Population Increase Data were recorded for each of...Ch. 3 - Prob. 85CRECh. 3 - Eating Out, Again College student Jacqueline Loya...Ch. 3 - Study Hours A group of 50 statistics students, 25...Ch. 3 - Driving Accidents College student Sandy Hudson...Ch. 3 - Exam Scores An exam has a mean of 70 and a...Ch. 3 - Boys’ Heights Three-year-old boys in the United...Ch. 3 - SAT and ACT Scores Quantitative SAT scores have a...Ch. 3 - Children’s Heights Mrs. Diaz has two children: a...Ch. 3 - Students’ Ages Here are the ages of some students...Ch. 3 - House Prices The figure, which is from data taken...
Knowledge Booster


Learn more about
Need a deep-dive on the concept behind this application? Look no further. Learn more about this topic, statistics and related others by exploring similar questions and additional content below.Similar questions
- Negate the following compound statement using De Morgans's laws.arrow_forwardQuestion 6: Negate the following compound statements, using De Morgan's laws. A) If Alberta was under water entirely then there should be no fossil of mammals.arrow_forwardNegate the following compound statement using De Morgans's laws.arrow_forward
- Characterize (with proof) all connected graphs that contain no even cycles in terms oftheir blocks.arrow_forwardLet G be a connected graph that does not have P4 or C3 as an induced subgraph (i.e.,G is P4, C3 free). Prove that G is a complete bipartite grapharrow_forwardProve sufficiency of the condition for a graph to be bipartite that is, prove that if G hasno odd cycles then G is bipartite as follows:Assume that the statement is false and that G is an edge minimal counterexample. That is, Gsatisfies the conditions and is not bipartite but G − e is bipartite for any edge e. (Note thatthis is essentially induction, just using different terminology.) What does minimality say aboutconnectivity of G? Can G − e be disconnected? Explain why if there is an edge between twovertices in the same part of a bipartition of G − e then there is an odd cyclearrow_forward
- Let G be a connected graph that does not have P4 or C4 as an induced subgraph (i.e.,G is P4, C4 free). Prove that G has a vertex adjacent to all othersarrow_forwardWe consider a one-period market with the following properties: the current stock priceis S0 = 4. At time T = 1 year, the stock has either moved up to S1 = 8 (with probability0.7) or down towards S1 = 2 (with probability 0.3). We consider a call option on thisstock with maturity T = 1 and strike price K = 5. The interest rate on the money marketis 25% yearly.(a) Find the replicating portfolio (φ, ψ) corresponding to this call option.(b) Find the risk-neutral (no-arbitrage) price of this call option.(c) We now consider a put option with maturity T = 1 and strike price K = 3 onthe same market. Find the risk-neutral price of this put option. Reminder: A putoption gives you the right to sell the stock for the strike price K.1(d) An investor with initial capital X0 = 0 wants to invest on this market. He buysα shares of the stock (or sells them if α is negative) and buys β call options (orsells them is β is negative). He invests the cash balance on the money market (orborrows if the amount is…arrow_forwardDetermine if the two statements are equivalent using a truth tablearrow_forward
- Question 4: Determine if pair of statements A and B are equivalent or not, using truth table. A. (~qp)^~q в. р л~9arrow_forwardDetermine if the two statements are equalivalent using a truth tablearrow_forwardQuestion 3: p and q represent the following simple statements. p: Calgary is the capital of Alberta. A) Determine the value of each simple statement p and q. B) Then, without truth table, determine the va q: Alberta is a province of Canada. for each following compound statement below. pvq р^~q ~рл~q ~q→ p ~P~q Pq b~ (d~ ← b~) d~ (b~ v d) 0 4arrow_forward
arrow_back_ios
SEE MORE QUESTIONS
arrow_forward_ios
Recommended textbooks for you
 Glencoe Algebra 1, Student Edition, 9780079039897...AlgebraISBN:9780079039897Author:CarterPublisher:McGraw Hill
 Holt Mcdougal Larson Pre-algebra: Student Edition...AlgebraISBN:9780547587776Author:HOLT MCDOUGALPublisher:HOLT MCDOUGAL
 Elementary Geometry For College Students, 7eGeometryISBN:9781337614085Author:Alexander, Daniel C.; Koeberlein, Geralyn M.Publisher:Cengage,
 Algebra: Structure And Method, Book 1AlgebraISBN:9780395977224Author:Richard G. Brown, Mary P. Dolciani, Robert H. Sorgenfrey, William L. ColePublisher:McDougal Littell
Glencoe Algebra 1, Student Edition, 9780079039897...
Algebra
ISBN:9780079039897
Author:Carter
Publisher:McGraw Hill
Holt Mcdougal Larson Pre-algebra: Student Edition...
Algebra
ISBN:9780547587776
Author:HOLT MCDOUGAL
Publisher:HOLT MCDOUGAL
Elementary Geometry For College Students, 7e
Geometry
ISBN:9781337614085
Author:Alexander, Daniel C.; Koeberlein, Geralyn M.
Publisher:Cengage,
Algebra: Structure And Method, Book 1
Algebra
ISBN:9780395977224
Author:Richard G. Brown, Mary P. Dolciani, Robert H. Sorgenfrey, William L. Cole
Publisher:McDougal Littell
Which is the best chart: Selecting among 14 types of charts Part II; Author: 365 Data Science;https://www.youtube.com/watch?v=qGaIB-bRn-A;License: Standard YouTube License, CC-BY