Weight Loss (Example 3) The table shows Minitab descriptive statistics for the weight of some women (weight_f) and men (weight_m), and the self-reported ideal weights for both. a. Subtract the women's mean weight from their mean ideal weight to find the mean desired weight change. Did the women (as a group) tend to want to lose or to gain weight? How do you know? b. Subtract the men's mean weight from their mean ideal weight to find the mean desired weight change. Did the men (as a group) tend to want to lose or to gain weight? How do you know? c. On average, which group wanted the greatest weight change? Compare the mean desired weight loss for women and men. d. Which group's real weights had more variation as shown by the standard deviations (in the column headed StDev)?
Weight Loss (Example 3) The table shows Minitab descriptive statistics for the weight of some women (weight_f) and men (weight_m), and the self-reported ideal weights for both. a. Subtract the women's mean weight from their mean ideal weight to find the mean desired weight change. Did the women (as a group) tend to want to lose or to gain weight? How do you know? b. Subtract the men's mean weight from their mean ideal weight to find the mean desired weight change. Did the men (as a group) tend to want to lose or to gain weight? How do you know? c. On average, which group wanted the greatest weight change? Compare the mean desired weight loss for women and men. d. Which group's real weights had more variation as shown by the standard deviations (in the column headed StDev)?
Solution Summary: The author compares the mean weight change of women and men, and determines whether they gain or lose weight.
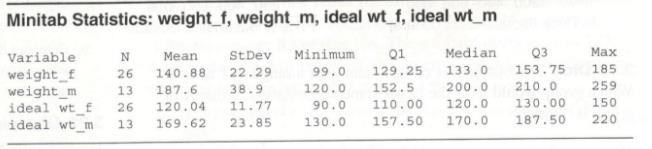
Weight Loss (Example 3) The table shows Minitab descriptive statistics for the weight of some women (weight_f) and men (weight_m), and the self-reported ideal weights for both.
a. Subtract the women's mean weight from their mean ideal weight to find the mean desired weight change. Did the women (as a group) tend to want to lose or to gain weight? How do you know?
b. Subtract the men's mean weight from their mean ideal weight to find the mean desired weight change. Did the men (as a group) tend to want to lose or to gain weight? How do you know?
c. On average, which group wanted the greatest weight change? Compare the mean desired weight loss for women and men.
d. Which group's real weights had more variation as shown by the standard deviations (in the column headed StDev)?
Statistics that help describe, summarize, and present information extracted from data. Descriptive statistics include concepts related to measures of central tendency, measures of variability, measures of frequency, shape of distribution, and some data visualization techniques/tools such as pivot tables, charts, and graphs.
7.1. If X has an exponential distribution with the
parameter 0, use the distribution function technique
to find the probability density of the random variable
Y = ln X.
bilaga in
dwreat
3. Please
What does the margin of error include? When a margin of error is reported for a survey, it includes
a. random sampling error and other practical difficulties like undercoverage and non-response
b. random sampling error, but not other practical difficulties like undercoverage and nonresponse
c. practical difficulties like undercoverage and nonresponse, but not random smapling error
d. none of the above is corret
Need a deep-dive on the concept behind this application? Look no further. Learn more about this topic, statistics and related others by exploring similar questions and additional content below.


 Glencoe Algebra 1, Student Edition, 9780079039897...AlgebraISBN:9780079039897Author:CarterPublisher:McGraw Hill
 Holt Mcdougal Larson Pre-algebra: Student Edition...AlgebraISBN:9780547587776Author:HOLT MCDOUGALPublisher:HOLT MCDOUGAL
 Big Ideas Math A Bridge To Success Algebra 1: Stu...AlgebraISBN:9781680331141Author:HOUGHTON MIFFLIN HARCOURTPublisher:Houghton Mifflin Harcourt