
Videos
JK flip flop:
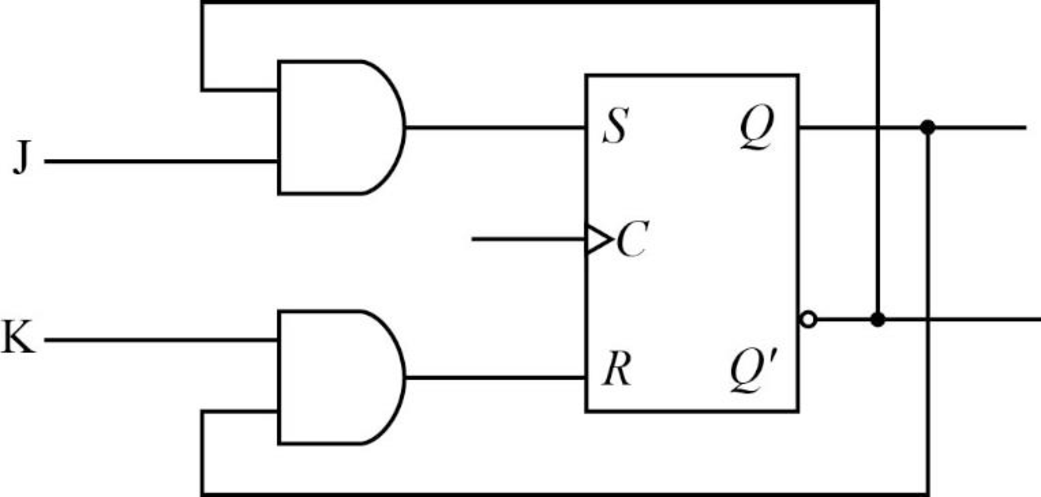
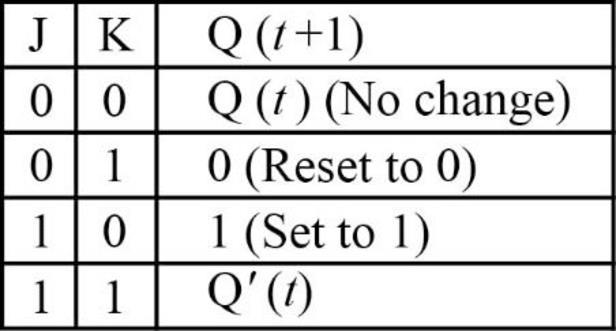
- JK stands for “Jack Kilby” who invented the integrated circuit. It is similar to SR flip flop but when the “J” and “K” inputs are both 0, there is no modification in the state.
- When the “J” and “K” inputs are both 1 at the clock edge then the output will toggle from one state to another state.
Circuit diagram:
Truth table:
Explanation:
In order to avoid undefined as an output value, the user must eliminate the condition at the very source by ensuring that both inputs never have the value “1”. This is done by creating an extension to the circuit where inputs to the SR are filtered to remove the possibility that both values are “1”. For this reason the JK flip flop often to prefer the SR flip flop.
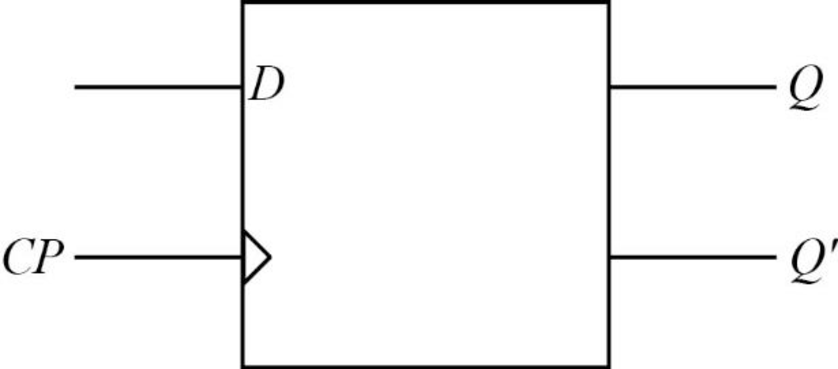
D flip flop:
One type of a flip flop which truly reflects how the computer storage works is the D flip flop, which is a sequential circuit. It stores one bit of information. The value stored in D flip flop is same as the input.
Circuit diagram:
Truth table:
| D | Output (Q(t + 1)) |
| 0 | 0 |
| 1 | 1 |
XOR gate:
The “X” in the XOR gate means “exclusive”. The result of the XOR gate will be 1, if any one of the input is 1 and 0 if both the inputs are 1 or 0.
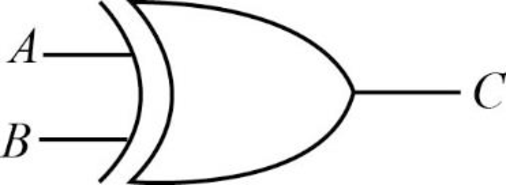
The truth table for XOR gate is given below:
| A | B | C = A XOR B |
| 0 | 0 | 0 |
| 0 | 1 | 1 |
| 1 | 0 | 1 |
| 1 | 1 | 0 |
Here, the Boolean expression of “A XOR B” gives 0 if both the inputs are 0 or 1 and 1 if any one of the input is 1.
Want to see the full answer?
Check out a sample textbook solution
Chapter 3 Solutions
Essentials of Computer Organization and Architecture


- Help! how do I fix my python coding question for this? (my code also provided)arrow_forwardNeed help with coding in this in python!arrow_forwardIn the diagram, there is a green arrow pointing from Input C (complete data) to Transformer Encoder S_B, which I don’t understand. The teacher model is trained on full data, but S_B should instead receive missing data—this arrow should not point there. Please verify and recreate the diagram to fix this issue. Additionally, the newly created diagram should meet the same clarity standards as the second diagram (Proposed MSCATN). Finally provide the output image of the diagram in image format .arrow_forward
- Please provide me with the output image of both of them . below are the diagrams code make sure to update the code and mentionned clearly each section also the digram should be clearly describe like in the attached image. please do not provide the same answer like in other question . I repost this question because it does not satisfy the requirment I need in terms of clarifty the output of both code are not very well details I have two diagram : first diagram code graph LR subgraph Teacher Model (Pretrained) Input_Teacher[Input C (Complete Data)] --> Teacher_Encoder[Transformer Encoder T] Teacher_Encoder --> Teacher_Prediction[Teacher Prediction y_T] Teacher_Encoder --> Teacher_Features[Internal Features F_T] end subgraph Student_A_Model[Student Model A (Handles Missing Values)] Input_Student_A[Input M (Data with Missing Values)] --> Student_A_Encoder[Transformer Encoder E_A] Student_A_Encoder --> Student_A_Prediction[Student A Prediction y_A] Student_A_Encoder…arrow_forwardWhy I need ?arrow_forwardHere are two diagrams. Make them very explicit, similar to Example Diagram 3 (the Architecture of MSCTNN). graph LR subgraph Teacher_Model_B [Teacher Model (Pretrained)] Input_Teacher_B[Input C (Complete Data)] --> Teacher_Encoder_B[Transformer Encoder T] Teacher_Encoder_B --> Teacher_Prediction_B[Teacher Prediction y_T] Teacher_Encoder_B --> Teacher_Features_B[Internal Features F_T] end subgraph Student_B_Model [Student Model B (Handles Missing Labels)] Input_Student_B[Input C (Complete Data)] --> Student_B_Encoder[Transformer Encoder E_B] Student_B_Encoder --> Student_B_Prediction[Student B Prediction y_B] end subgraph Knowledge_Distillation_B [Knowledge Distillation (Student B)] Teacher_Prediction_B -- Logits Distillation Loss (L_logits_B) --> Total_Loss_B Teacher_Features_B -- Feature Alignment Loss (L_feature_B) --> Total_Loss_B Partial_Labels_B[Partial Labels y_p] -- Prediction Loss (L_pred_B) --> Total_Loss_B Total_Loss_B -- Backpropagation -->…arrow_forward
- Please provide me with the output image of both of them . below are the diagrams code I have two diagram : first diagram code graph LR subgraph Teacher Model (Pretrained) Input_Teacher[Input C (Complete Data)] --> Teacher_Encoder[Transformer Encoder T] Teacher_Encoder --> Teacher_Prediction[Teacher Prediction y_T] Teacher_Encoder --> Teacher_Features[Internal Features F_T] end subgraph Student_A_Model[Student Model A (Handles Missing Values)] Input_Student_A[Input M (Data with Missing Values)] --> Student_A_Encoder[Transformer Encoder E_A] Student_A_Encoder --> Student_A_Prediction[Student A Prediction y_A] Student_A_Encoder --> Student_A_Features[Student A Features F_A] end subgraph Knowledge_Distillation_A [Knowledge Distillation (Student A)] Teacher_Prediction -- Logits Distillation Loss (L_logits_A) --> Total_Loss_A Teacher_Features -- Feature Alignment Loss (L_feature_A) --> Total_Loss_A Ground_Truth_A[Ground Truth y_gt] -- Prediction Loss (L_pred_A)…arrow_forwardI'm reposting my question again please make sure to avoid any copy paste from the previous answer because those answer did not satisfy or responded to the need that's why I'm asking again The knowledge distillation part is not very clear in the diagram. Please create two new diagrams by separating the two student models: First Diagram (Student A - Missing Values): Clearly illustrate the student training process. Show how knowledge distillation happens between the teacher and Student A. Explain what the teacher teaches Student A (e.g., handling missing values) and how this teaching occurs (e.g., through logits, features, or attention). Second Diagram (Student B - Missing Labels): Similarly, detail the training process for Student B. Clarify how knowledge distillation works between the teacher and Student B. Specify what the teacher teaches Student B (e.g., dealing with missing labels) and how the knowledge is transferred. Since these are two distinct challenges…arrow_forwardThe knowledge distillation part is not very clear in the diagram. Please create two new diagrams by separating the two student models: First Diagram (Student A - Missing Values): Clearly illustrate the student training process. Show how knowledge distillation happens between the teacher and Student A. Explain what the teacher teaches Student A (e.g., handling missing values) and how this teaching occurs (e.g., through logits, features, or attention). Second Diagram (Student B - Missing Labels): Similarly, detail the training process for Student B. Clarify how knowledge distillation works between the teacher and Student B. Specify what the teacher teaches Student B (e.g., dealing with missing labels) and how the knowledge is transferred. Since these are two distinct challenges (missing values vs. missing labels), they should not be combined in the same diagram. Instead, create two separate diagrams for clarity. For reference, I will attach a second image…arrow_forward
 Database System ConceptsComputer ScienceISBN:9780078022159Author:Abraham Silberschatz Professor, Henry F. Korth, S. SudarshanPublisher:McGraw-Hill Education
 Starting Out with Python (4th Edition)Computer ScienceISBN:9780134444321Author:Tony GaddisPublisher:PEARSON
 Digital Fundamentals (11th Edition)Computer ScienceISBN:9780132737968Author:Thomas L. FloydPublisher:PEARSON
 C How to Program (8th Edition)Computer ScienceISBN:9780133976892Author:Paul J. Deitel, Harvey DeitelPublisher:PEARSON
 Database Systems: Design, Implementation, & Manag...Computer ScienceISBN:9781337627900Author:Carlos Coronel, Steven MorrisPublisher:Cengage Learning
 Programmable Logic ControllersComputer ScienceISBN:9780073373843Author:Frank D. PetruzellaPublisher:McGraw-Hill Education