
Concept explainers
Videos
a.
Construct a
a.
Answer to Problem 30CT
Explanation of Solution
Given information:
Income generated from 2011 to 2017.
| Year | Revenue |
| 2011 | 66.1 |
| 2012 | 116.9 |
| 2013 | 197.5 |
| 2014 | 325.9 |
| 2015 | 644.7 |
| 2016 | 846.6 |
| 2017 | 1076.8 |
Assume t=1 at 2011.
b.
Suitable Model for the data and coefficient of determination.
b.
Answer to Problem 30CT
The equation of linear model is
The coefficient of determination is 0.94.
Explanation of Solution
Given information:
| Year | Revenue |
| 2011 | 66.1 |
| 2012 | 116.9 |
| 2013 | 197.5 |
| 2014 | 325.9 |
| 2015 | 644.7 |
| 2016 | 846.6 |
| 2017 | 1076.8 |
Formula used:
Coefficient of determination
Mean of x is 4
Mean of y is 467.7.
| X | Y | X - Mx | Y - My | ( X - Mx)2 | ( X - Mx)( Y - My) |
| 1 | 66.1 | -3 | -401.686 | 9 | 1205.0571 |
| 2 | 116.9 | -2 | -350.886 | 4 | 701.7714 |
| 3 | 197.5 | -1 | -270.286 | 1 | 270.2857 |
| 4 | 325.9 | 0 | -141.886 | 0 | 0 |
| 5 | 644.7 | 1 | 176.9143 | 1 | 176.9143 |
| 6 | 846.6 | 2 | 378.8143 | 4 | 757.6286 |
| 7 | 1076.8 | 3 | 609.0143 | 9 | 1827.0429 |
Linear regression equation:
Where,
The equation of linear model is
Coefficient of determination:
| X | Y | X2 | Y2 | XY |
| 1 | 66.1 | 1 | 4369.21 | 66.1 |
| 2 | 116.9 | 4 | 13665.61 | 233.8 |
| 3 | 197.5 | 9 | 39006.25 | 592.5 |
| 4 | 325.9 | 16 | 106210.8 | 1303.6 |
| 5 | 644.7 | 25 | 415638.1 | 3223.5 |
| 6 | 846.6 | 36 | 716731.6 | 5079.6 |
| 7 | 1076.8 | 49 | 1159498 | 7537.6 |
The coefficient of determination:
The coefficient of determination is 0.94.
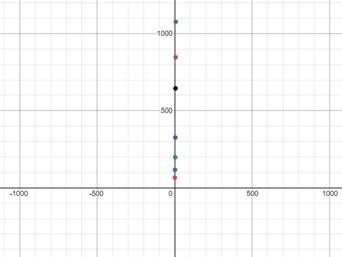
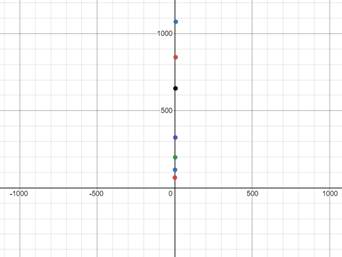
c.
Construct the graph with the help of graphing utility.
c.
Answer to Problem 30CT
Explanation of Solution
Given information:
The equation of linear model is
The graph of

d.
Whether the model is fit for data or not.
d.
Answer to Problem 30CT
Yes, the model is fit for data.
Explanation of Solution
As
As
Chapter 3 Solutions
EP PRECALC.GRAPHING APPR.-WEBASSIGN-1YR


- 3. Consider the sequences of functions f₁: [-π, π] → R, sin(n²x) An(2) n f pointwise as (i) Find a function ƒ : [-T,π] → R such that fn n∞. Further, show that fn →f uniformly on [-π,π] as n → ∞. [20 Marks] (ii) Does the sequence of derivatives f(x) has a pointwise limit on [-7, 7]? Justify your answer. [10 Marks]arrow_forward1. (i) Give the definition of a metric on a set X. [5 Marks] (ii) Let X = {a, b, c} and let a function d : XxX → [0, ∞) be defined as d(a, a) = d(b,b) = d(c, c) 0, d(a, c) = d(c, a) 1, d(a, b) = d(b, a) = 4, d(b, c) = d(c,b) = 2. Decide whether d is a metric on X. Justify your answer. = (iii) Consider a metric space (R, d.), where = [10 Marks] 0 if x = y, d* (x, y) 5 if xy. In the metric space (R, d*), describe: (a) open ball B2(0) of radius 2 centred at 0; (b) closed ball B5(0) of radius 5 centred at 0; (c) sphere S10 (0) of radius 10 centred at 0. [5 Marks] [5 Marks] [5 Marks]arrow_forward(c) sphere S10 (0) of radius 10 centred at 0. [5 Marks] 2. Let C([a, b]) be the metric space of continuous functions on the interval [a, b] with the metric doo (f,g) = max f(x)g(x)|. xЄ[a,b] = 1x. Find: Let f(x) = 1 - x² and g(x): (i) do(f, g) in C'([0, 1]); (ii) do(f,g) in C([−1, 1]). [20 Marks] [20 Marks]arrow_forward
- Given lim x-4 f (x) = 1,limx-49 (x) = 10, and lim→-4 h (x) = -7 use the limit properties to find lim→-4 1 [2h (x) — h(x) + 7 f(x)] : - h(x)+7f(x) 3 O DNEarrow_forward17. Suppose we know that the graph below is the graph of a solution to dy/dt = f(t). (a) How much of the slope field can you sketch from this information? [Hint: Note that the differential equation depends only on t.] (b) What can you say about the solu- tion with y(0) = 2? (For example, can you sketch the graph of this so- lution?) y(0) = 1 y ANarrow_forward(b) Find the (instantaneous) rate of change of y at x = 5. In the previous part, we found the average rate of change for several intervals of decreasing size starting at x = 5. The instantaneous rate of change of fat x = 5 is the limit of the average rate of change over the interval [x, x + h] as h approaches 0. This is given by the derivative in the following limit. lim h→0 - f(x + h) − f(x) h The first step to find this limit is to compute f(x + h). Recall that this means replacing the input variable x with the expression x + h in the rule defining f. f(x + h) = (x + h)² - 5(x+ h) = 2xh+h2_ x² + 2xh + h² 5✔ - 5 )x - 5h Step 4 - The second step for finding the derivative of fat x is to find the difference f(x + h) − f(x). - f(x + h) f(x) = = (x² x² + 2xh + h² - ])- = 2x + h² - 5h ])x-5h) - (x² - 5x) = ]) (2x + h - 5) Macbook Proarrow_forward
- Evaluate the integral using integration by parts. Sx² cos (9x) dxarrow_forwardLet f be defined as follows. y = f(x) = x² - 5x (a) Find the average rate of change of y with respect to x in the following intervals. from x = 4 to x = 5 from x = 4 to x = 4.5 from x = 4 to x = 4.1 (b) Find the (instantaneous) rate of change of y at x = 4. Need Help? Read It Master Itarrow_forwardVelocity of a Ball Thrown into the Air The position function of an object moving along a straight line is given by s = f(t). The average velocity of the object over the time interval [a, b] is the average rate of change of f over [a, b]; its (instantaneous) velocity at t = a is the rate of change of f at a. A ball is thrown straight up with an initial velocity of 128 ft/sec, so that its height (in feet) after t sec is given by s = f(t) = 128t - 16t². (a) What is the average velocity of the ball over the following time intervals? [3,4] [3, 3.5] [3, 3.1] ft/sec ft/sec ft/sec (b) What is the instantaneous velocity at time t = 3? ft/sec (c) What is the instantaneous velocity at time t = 7? ft/sec Is the ball rising or falling at this time? O rising falling (d) When will the ball hit the ground? t = sec Need Help? Read It Watch Itarrow_forward
 Calculus: Early TranscendentalsCalculusISBN:9781285741550Author:James StewartPublisher:Cengage Learning
 Thomas' Calculus (14th Edition)CalculusISBN:9780134438986Author:Joel R. Hass, Christopher E. Heil, Maurice D. WeirPublisher:PEARSON
 Calculus: Early Transcendentals (3rd Edition)CalculusISBN:9780134763644Author:William L. Briggs, Lyle Cochran, Bernard Gillett, Eric SchulzPublisher:PEARSON
 Calculus: Early TranscendentalsCalculusISBN:9781319050740Author:Jon Rogawski, Colin Adams, Robert FranzosaPublisher:W. H. Freeman
 Calculus: Early Transcendental FunctionsCalculusISBN:9781337552516Author:Ron Larson, Bruce H. EdwardsPublisher:Cengage Learning