
Concept explainers
Videos
(a)
To find: The linear model of the data.
(a)
Answer to Problem 31E
Explanation of Solution
Given:The population P (in millions) of Jamacia for the years 2001 through 2016 are shown in the table, where t represents the year, with
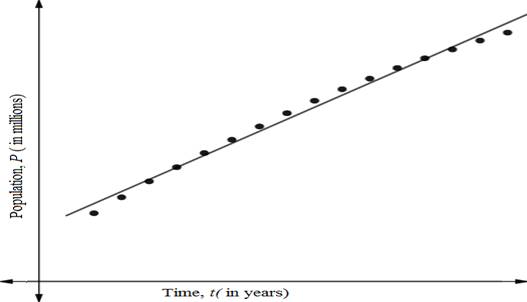
Using regression graphing calculator, the linear model of the above data is
The coefficient of determination is
Now plot the model and data on same window view.
(b)
To find: The power model of the data.
(b)
Answer to Problem 31E
Explanation of Solution
Given: The population P (in millions) of Jamacia for the years 2001 through 2016 are shown in the table, where t represents the year, with
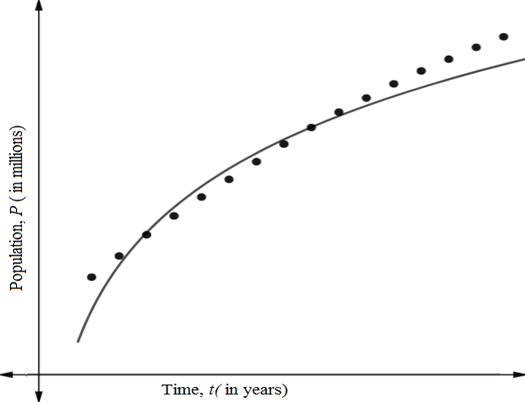
Using regression graphing calculator, the power model of the above data is
The coefficient of determination is
Now plot the model and data on same window view.
(c)
To find: The exponential model of the data.
(c)
Answer to Problem 31E
Explanation of Solution
Given: The population P (in millions) of Jamacia for the years 2001 through 2016 are shown in the table, where t represents the year, with
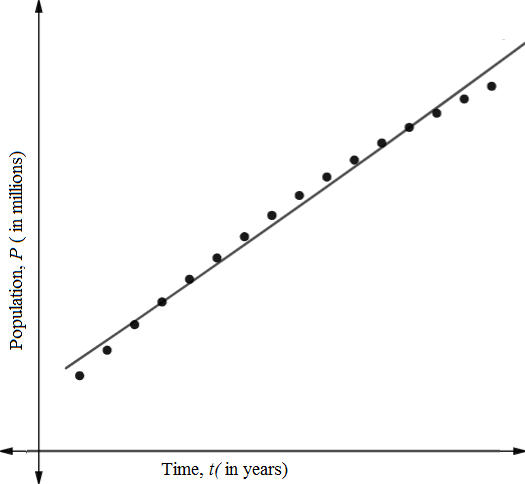
Using regression graphing calculator, the exponential model of the above data is
The coefficient of determination is
Now plot the model and data on same window view.
(d)
To find: The logarithmic model of the data.
(d)
Answer to Problem 31E
Explanation of Solution
Given: The population P (in millions) of Jamacia for the years 2001 through 2016 are shown in the table, where t represents the year, with
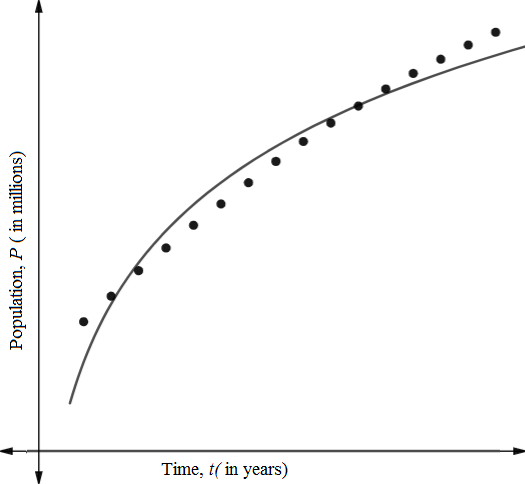
Using regression graphing calculator, the logarithmic model of the above data is
The coefficient of determination is
Now plot the model and data on same window view.
(e)
To find: The model which is best fit for data.
(e)
Answer to Problem 31E
Linear Model
Explanation of Solution
Given: The population P (in millions) of Jamacia for the years 2001 through 2016 are shown in the table, where t represents the year, with
Linear model,
Power model,
Exponential model,
Logarithmic model,
The coefficient of determination of linear model is nearest 1.
So, Best fir model would be linear model.
(f)
To find: The population in year 2025 of each model.
(f)
Answer to Problem 31E
For linear model population in Jamaica is 3.014
For power model population in Jamaica is 2.909
For exponential model population in Jamaica is 3.024
For logarithmic model population in Jamaica is 2.908
Explanation of Solution
Given: The population P (in millions) of Jamacia for the years 2001 through 2016 are shown in the table, where t represents the year, with
For 2025 corresponding value of
Put
Linear model,
Power model,
Exponential model,
Logarithmic model,
(g)
To predict: The best fir model for population in year 2025.
(g)
Answer to Problem 31E
Power model
Explanation of Solution
Given: The population P (in millions) of Jamacia for the years 2001 through 2016 are shown in the table, where t represents the year, with
For 2025 corresponding value of
Put
Linear model,
Power model,
Exponential model,
Logarithmic model,
According to above calculation best model is power model.
(h)
To choose: The model different for different cases.
(h)
Answer to Problem 31E
No
Explanation of Solution
Given: The population P (in millions) of Jamacia for the years 2001 through 2016 are shown in the table, where t represents the year, with
For 2025 corresponding value of
Put
Linear model,
Power model,
Exponential model,
Logarithmic model,
According to above calculation best model is power model.
According to graph best model is linear because the coefficient of determination is nearest to 1 but according to calculation model is different because data may be vary.
Chapter 3 Solutions
EP PRECALC.GRAPHING APPR.-WEBASSIGN-1YR


- ~ exp(10). A 3. Claim number per policy is modelled by Poisson(A) with A sample x of N = 100 policies presents an average = 4 claims per policy. (i) Compute an a priory estimate of numbers of claims per policy. [2 Marks] (ii) Determine the posterior distribution of A. Give your argument. [5 Marks] (iii) Compute an a posteriori estimate of numbers of claims per policy. [3 Marks]arrow_forward2. The size of a claim is modelled by F(a, λ) with a fixed a a maximum likelihood estimate of A given a sample x with a sample mean x = 11 = 121. Give [5 Marks]arrow_forwardRobbie Bearing Word Problems Angles name: Jocelyn date: 1/18 8K 2. A Delta airplane and an SouthWest airplane take off from an airport at the same time. The bearing from the airport to the Delta plane is 23° and the bearing to the SouthWest plane is 152°. Two hours later the Delta plane is 1,103 miles from the airport and the SouthWest plane is 1,156 miles from the airport. What is the distance between the two planes? What is the bearing from the Delta plane to the SouthWest plane? What is the bearing to the Delta plane from the SouthWest plane? Delta y SW Angles ThreeFourthsMe MATH 2arrow_forward
 Calculus: Early TranscendentalsCalculusISBN:9781285741550Author:James StewartPublisher:Cengage Learning
 Thomas' Calculus (14th Edition)CalculusISBN:9780134438986Author:Joel R. Hass, Christopher E. Heil, Maurice D. WeirPublisher:PEARSON
 Calculus: Early Transcendentals (3rd Edition)CalculusISBN:9780134763644Author:William L. Briggs, Lyle Cochran, Bernard Gillett, Eric SchulzPublisher:PEARSON
 Calculus: Early TranscendentalsCalculusISBN:9781319050740Author:Jon Rogawski, Colin Adams, Robert FranzosaPublisher:W. H. Freeman
 Calculus: Early Transcendental FunctionsCalculusISBN:9781337552516Author:Ron Larson, Bruce H. EdwardsPublisher:Cengage Learning