
Videos
(a)
To find: The slope of the tangent line to the parabola
(a)
Answer to Problem 3E
The slope of the tangent line to the parabola
(i) Using Definition 1 is
(ii) Using Equation 2 is
Explanation of Solution
Given:
The slope of the tangent line to the parabola
Formula used:
Definition 1: The slope of the tangent curve
Equation 2: The slope of the tangent line in definition 1 becomes,
Section (i)
Obtain the slope of the tangent line to the parabola at the point (1, 3) by using Definition 1.
Substitute
The factors of
Therefore, the slope of the tangent line to the parabola becomes,
Since the limit x approaches 1 but not equal to 1, cancel the common term
Thus, the slope of the tangent line to the parabola at the point (1, 3) is
Section (ii)
Obtain the slope of the tangent line to the parabola at the point (1, 3) by using Equation 2.
Substitute
Simplify further and obtain the value of m.
Since the limit h tends to 0 but not equal to 0, cancel the common term
Thus, the slope of the tangent line becomes,
Thus, the slope of the tangent line to the parabola at the point (1, 3) by using equation 2 is
(b)
To find: The equation of the tangent line in part(a).
(b)
Answer to Problem 3E
The equation of the tangent line in part (a) is
Explanation of Solution
Equation of the tangent line:
The equation of the tangent line to the curve
Since the tangent line to the curve
Substitute
Isolate y as shown below.
Thus, the equation of the tangent line is
(c)
To sketch: The graph of the function is the tangent line,
(c)
Explanation of Solution
Calculation:
The equation of the tangent line is
The equation of the given curve is
Use the online graphing calculator to draw the graph of the functions as shown below in Figure 1.
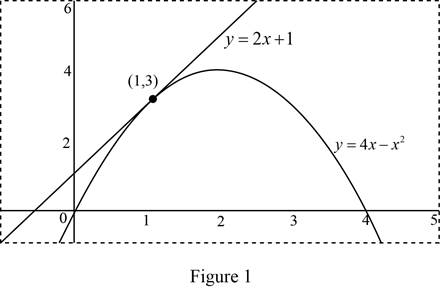
Graph:
Use the online graphing calculator to zoom toward the point (1,3) as shown below in Figure 2.
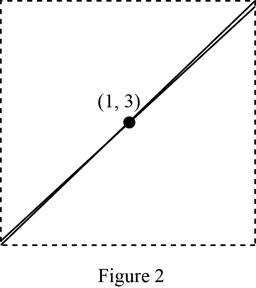
From Figure 2, it is observed that when zoom in the graph toward the point (1, 3), the graph of the tangent line and the curve looks likes almost identical.
Hence, it is verified that the graph of the tangent line and the parabola zoom in toward the point (1, 3) until the tangent line are indistinguishable.
Chapter 2 Solutions
Single Variable Calculus: Concepts and Contexts, Enhanced Edition


- How does a fourier transform works?arrow_forwardDetermine the radius of convergence of a power series:12.6.5, 12.6.6, 12.6.7, 12.6.8Hint: Use Theorem12.5.1 and root test, ratio test, integral testarrow_forwardCan you answer this question and give step by step and why and how to get it. Can you write it (numerical method)arrow_forward
- Can you answer this question and give step by step and why and how to get it. Can you write it (numerical method)arrow_forwardThere are three options for investing $1150. The first earns 10% compounded annually, the second earns 10% compounded quarterly, and the third earns 10% compounded continuously. Find equations that model each investment growth and use a graphing utility to graph each model in the same viewing window over a 20-year period. Use the graph to determine which investment yields the highest return after 20 years. What are the differences in earnings among the three investment? STEP 1: The formula for compound interest is A = nt = P(1 + − − ) n², where n is the number of compoundings per year, t is the number of years, r is the interest rate, P is the principal, and A is the amount (balance) after t years. For continuous compounding, the formula reduces to A = Pert Find r and n for each model, and use these values to write A in terms of t for each case. Annual Model r=0.10 A = Y(t) = 1150 (1.10)* n = 1 Quarterly Model r = 0.10 n = 4 A = Q(t) = 1150(1.025) 4t Continuous Model r=0.10 A = C(t) =…arrow_forwardUse a graphing utility to find the point of intersection, if any, of the graphs of the functions. Round your result to three decimal places. (Enter NONE in any unused answer blanks.) y = 100e0.01x (x, y) = y = 11,250 ×arrow_forward
- 5. For the function y-x³-3x²-1, use derivatives to: (a) determine the intervals of increase and decrease. (b) determine the local (relative) maxima and minima. (e) determine the intervals of concavity. (d) determine the points of inflection. (e) sketch the graph with the above information indicated on the graph.arrow_forwardCan you solve this 2 question numerical methodarrow_forward1. Estimate the area under the graph of f(x)-25-x from x=0 to x=5 using 5 approximating rectangles Using: (A) right endpoints. (B) left endpoints.arrow_forward
- 9. Use fundamental theorem of calculus to find the derivative d a) *dt sin(x) b)(x)√1-2 dtarrow_forward3. Evaluate the definite integral: a) √66x²+8dx b) x dx c) f*(2e* - 2)dx d) √√9-x² e) (2-5x)dx f) cos(x)dx 8)²₁₂√4-x2 h) f7dx i) f² 6xdx j) ²₂(4x+3)dxarrow_forward2. Consider the integral √(2x+1)dx (a) Find the Riemann sum for this integral using right endpoints and n-4. (b) Find the Riemann sum for this same integral, using left endpoints and n=4arrow_forward
 Calculus: Early TranscendentalsCalculusISBN:9781285741550Author:James StewartPublisher:Cengage Learning
 Thomas' Calculus (14th Edition)CalculusISBN:9780134438986Author:Joel R. Hass, Christopher E. Heil, Maurice D. WeirPublisher:PEARSON
 Calculus: Early Transcendentals (3rd Edition)CalculusISBN:9780134763644Author:William L. Briggs, Lyle Cochran, Bernard Gillett, Eric SchulzPublisher:PEARSON
 Calculus: Early TranscendentalsCalculusISBN:9781319050740Author:Jon Rogawski, Colin Adams, Robert FranzosaPublisher:W. H. Freeman
 Calculus: Early Transcendental FunctionsCalculusISBN:9781337552516Author:Ron Larson, Bruce H. EdwardsPublisher:Cengage Learning