
Concept explainers
Videos
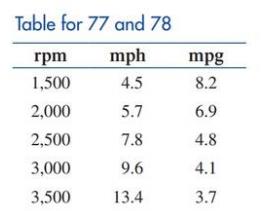
Outboard motors. The table gives performance data for a boat powered by an Evinrude outboard motor. Find a quadratic regression model
Want to see the full answer?
Check out a sample textbook solution
Chapter 2 Solutions
Finite Mathematics for Business, Economics, Life Sciences and Social Sciences
Additional Math Textbook Solutions
Finite Mathematics & Its Applications (12th Edition)
Using & Understanding Mathematics: A Quantitative Reasoning Approach (7th Edition)
Mathematics for Elementary Teachers with Activities (5th Edition)
Calculus for Business, Economics, Life Sciences, and Social Sciences (13th Edition)
Probability and Statistics for Engineers and Scientists


- Does Table 2 represent a linear function? If so, finda linear equation that models the data.arrow_forwardAlligators The length in inches and weight in pounds of 25 alligators is shown in the table. Find the quadratic function that best fits the data. Round a,b, and c to six decimal places. Use the regression function to estimate the weight of an alligator that is 130 inches long. Round the weight to the nearest pound. Length Weight Length Weight Length Weight 94 130 72 38 90 106 74 51 128 366 89 84 147 640 85 84 68 39 58 28 82 80 76 42 86 80 86 83 114 197 94 110 88 70 90 102 63 33 72 61 78 57 86 90 74 54 69 36 61 44arrow_forwardbThe average rate of change of the linear function f(x)=3x+5 between any two points is ________.arrow_forward
- while in high school, Clayton started his T-shirt printing business. The table shows the number of T-shirts Clayton has sold each year since starting his business in 2010 year 2010 2011 2012 2013 2014 2015 2016 number of t-shirts 50 75 175 125 250 350 375 the linear regression equation representing the data shown in the table is y=57.14x + 28.57, where x represents the number of years since 2010 and y represents the number of T-shirts sold. expression unit contextual meaning mathematical meaning y 57.14 x 28.57 use the regression equation to predict the number of T-shirts Clayton sold during each given year then compare the prediction to actual number of T-shirt or determine if the prediction is reasonable based on the problem situation. 2012 2014 2016 2018 2024arrow_forwardThe owner of Showtime Movie Theaters, Inc., used multiple regression analysis to predict gross revenue (y) as a function of television advertising (1) and newspaper advertising (2). Values of y, ₁, and 2 are expressed in thousands of dollars. Click on the datafile logo to reference the data. DATA file The estimated regression equation was Weekly Gross Revenue ($1000s) 96 90 95 92 95 94 94 94 Television Advertising ($1000s) 5.0 2.0 4.0 2.5 3.0 3.5 2.5 3.0 Newspaper Advertising ($1000s) 1.5 2.0 1.5 2.5 3.3 2.3 4.2 2.5 ŷ = 83.23 +2.29x1 + 1.30x2 a. What is the gross revenue expected for a week where $3,500 is spent on television (1 = 3.5) and $1,800 is spent on newspaper advertising (2 = 1.8) (to 3 decimals)? Hint(s) Check My Work $ thousand b. Provide a 95% prediction interval for next week's revenue, assuming that the advertising expenditures will be allocated as in part (a) (to 2 decimals). ($ * thousand, $ * thousand)arrow_forwardThe managing director of a consulting group has the accompanying monthly data on total overhead costs and professional labor hours to bill to clients. Complete parts a through c. E Click the icon to view the monthly data. a. Develop a simple linear regression model between billable hours and overhead costs. Overhead Costs = 5304.4 + (0.0219) × Billable Hours +1 (Round the constant to one decimal place as needed. Round the coefficient to four decimal places as needed. Do not include the $ symbol in your answers.) Monthly overhead costs and billable hours data Overhead Costs Billable Hours O IT $385,000 3,000 $430,000 4,000 $460,000 5,000 $511,000 6,000 $580,000 7,000 $600,000 8,000 Print Donearrow_forward
- A company manufactures memory chips for microcomputers. The table below shows the price, p. per chip at which x million chips can be sold. Using linear regression on a graphing calculator, the price-demand function to model this data is given by p(x) = 84 - 4x x (millions) p ($) B0 4. 68 6. 48 a. Graph the data and the model on the same coordinate system. Choose the correct graph below. All graphs are shown on a scale of 10,25,5) by 10,100,10). where the x-axis represents the number of chips sold (in milions) and the y-axis represents the price in dollars OD. Q Next an Jy 13M 04Da 1 80 4 68 48 14 28 20 4 b. Use p(x) to estimate the price per chip for a demand of 4 million chips. The price per chip for 4 million chips will be $ (Round to nearest integer.) c. Use p(x) to estimate the demand at a price of $3. The demand at a price of $3 is million chinsarrow_forwardTire pressure (psi) and mileage (mpg) were recorded for a random sample of seven cars of thesame make and model. The extended data table (left) and fit model report (right) are based on aquadratic model. Calculate R2. Describe what this value means in the context of the problem.arrow_forwardUse regression to find a quadratic model for the given data. x 1 2 3 7 y 9 5 24 -2 y=arrow_forward
- The data below is the amount of tar and nicotine in a sample of different brands of 100 mm, non-menthol, filtered cigarettes. a) Using the calculator, find a linear regression model that gives the amount of nicotine, N, as a function of the amount of tar, t. Write the function below. N(t)= b) use this model of nicotine to estimate the amount of nicotine in a cigarette if the amount of tar is listed as 21 mg. c) What is the correlation coefficient, r, for this model? r= Tar 5 16 17 13 13 14 9 15 2 15 13 14 15 16 7 17 Nicotine 0.4 1 1.2 0.8 0.8 1 0.8 1 0.2 1.1 0.8 1 0.9 1.1 0.6 1.3arrow_forwardAn analysis of the calcium content (in mg) and the magnesium content (in mg) in bread produced this regression model: calcium = 36 +30 magnesium. Select the best explanation of the slope. O A. The model predicts that bread will have approximately 30 more milligrams of magnesium for every additional milligram of calcium. O B. The model predicts that bread will have approximately 36 more milligrams of magnesium for every additional milligram of calcium. O C. The model predicts that bread will have approximately 36 more milligrams of calcium for every additional milligram of magnesium. O D. The model predicts that bread will have approximately 30 more milligrams of calcium for every additional milligram of magnesium. Click to select your answer. 41,688 DEC 12arrow_forwardThe managing director of a consulting group has the accompanying monthly data on total overhead costs and professional labor hours to bill to clients. Complete parts a through c Click the icon to view the monthly data. a. Develop a simple linear regression model between billable hours and overhead costs. Overhead Costs = 247733.3 +(43.2000) x Billable Hours (Round the constant to one decimal place as needed. Round the coefficient to four decimal places as needed. Do not include the $ symbol in your answers.) b. Interpret the coefficients of your regression model. Specifically, what does the fixed component of the model mean to the consulting firm? Interpret the fixed term, bo. if appropriate. Choose the correct answer below. OA. The value of by is the predicted overhead costs for 0 billable hours. OB. For each increase of 1 unit in overhead costs, the predicted billable hours are estimated to increase by bo OC. It is not appropriate to interpret by. because its value is the predicted…arrow_forward
 College Algebra (MindTap Course List)AlgebraISBN:9781305652231Author:R. David Gustafson, Jeff HughesPublisher:Cengage Learning
 Glencoe Algebra 1, Student Edition, 9780079039897...AlgebraISBN:9780079039897Author:CarterPublisher:McGraw Hill
 College AlgebraAlgebraISBN:9781305115545Author:James Stewart, Lothar Redlin, Saleem WatsonPublisher:Cengage Learning
 Algebra and Trigonometry (MindTap Course List)AlgebraISBN:9781305071742Author:James Stewart, Lothar Redlin, Saleem WatsonPublisher:Cengage Learning
 Algebra for College StudentsAlgebraISBN:9781285195780Author:Jerome E. Kaufmann, Karen L. SchwittersPublisher:Cengage Learning