
Concept explainers
Videos
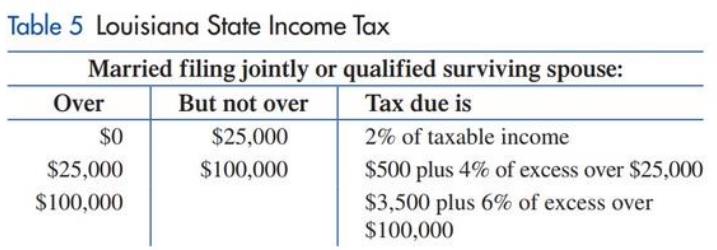
State income tax. Table
(A) Write a piecewise definition for
(B) Graph
(C) Find the tax due on a taxable income of
Want to see the full answer?
Check out a sample textbook solution
Chapter 2 Solutions
Finite Mathematics for Business, Economics, Life Sciences and Social Sciences
Additional Math Textbook Solutions
Using and Understanding Mathematics: A Quantitative Reasoning Approach (6th Edition)
Mathematics with Applications In the Management, Natural and Social Sciences (11th Edition)
Thinking Mathematically (6th Edition)
Mathematics All Around (6th Edition)
A Problem Solving Approach to Mathematics for Elementary School Teachers (12th Edition)
Fundamentals of Differential Equations and Boundary Value Problems


- Find the slope ofthe line in Figure l.arrow_forwardFind the slpoe of the line: y=7arrow_forwardA company is planning to manufacture mountain bikes. Fixed monthly cost will be $300,000 and it will cost $200 to produce each bicycle. A. Write the cost function, C, of producing x mountain bikes. C(x) = per month B. Write the average cost function, C, of producing x mountain bikes. C(x) = per month %3D C. How many mountain bikes must be produced each month for the company to have an average cost of $300 per bike? must be produced each month. Enter your answer in each of the answer boxes.arrow_forward
- In a given year, the U.S. federal income tax owed by a married couple filing jointly can be found from the following table. Married Filing Jointly Taxable Income $0-$18,550 T(x) = $18,551-$75,300 $75,301-$151,900 amount over $75,300 $413,351-$466,950 Tax Rate 10% $1,855 plus 15% of the amount over $18,550 $10,367.50 plus 25% of the $151,901-$231,450 amount over $151,900 $466,951 or more if $29,517.50 plus 28% of the $231,451-$413,350 amount over $231,450 $51,791.50 plus 33% of the $130,578.50 plus 39.6% of the amount over $466,950 (a) For incomes up to $151,900, write the piecewise defined function T with input x that models the federal tax dollars due as a function of x, the taxable income dollars earned. $111,818.50 plus 35% of the amount over $413,350 0 < x≤ 18,550 if 18,550 < x≤ 75,300 if 75,300 < x≤ 151,900 (b) Use the function to find T(40,000). $ (c) Find the tax due on a taxable inco of $90,000. $ (d) A friend tells Jack Waddell not to earn any money over $75,300 because it…arrow_forwardPLS HELParrow_forward1. Determine whether the variable is categorical or numeric. If the variable is numeric, determine whether the phenomenon of interest is discrete or continuous. The income of the families of clients seen at the clinic. Select one: a. Numeric, continuous b. Categorical c. Numeric, discretearrow_forward
- determine the largest and smallest value of the function y=3sinx+4arrow_forwardRashid works at an animal centre. The animal centre sells tickets for 49 weeks of the year. A student ticket costs £9.90 The animal centre sold 23 student tickets last week. Rashid assumes that the same number of student tickets are sold each week. He wants to estimate the income from the sale of student tickets for the vear (b) Estimate the income from the sale of student tickets for the year. (Total for Question 4 is TOTAI FOnarrow_forwardThe cost for board exam review services costs P11500, P11750, and P11250 for years 2018, 2019, and 2020 respectively. What is the correct equation to obtain range (in %)? (Range example: From -25% to +15%) a From "[(Average Cost-Lowest Cost)/Average Cost] x 100" to "[(Average Cost-Highest Cost/Average Cost] x 100" O b From "(Lowest Cost/Average Cost) x 100" to "(Highest Cost/Average Cost) x 100" O C. From “[(Lowest Cost-Average Cost)/Average Cost] x 100" to "[[Highest Cost- Average Cost)/Average Cost] x 100" Od. From "(Average Cost/Lowest Cost) x 100" to "(Average Cost/Highest Cost) x 100"arrow_forward
- The following table shows the expenses and income for a local college student. Assume that amounts shown for salaries and wages are after taxes and that 1 month = 4 weeks. Income Expenses Part-time Job: $1100/month Rent: $550/month Student Loans: $8400/year Groceries: $50/week Scholarship: $5700/year Tuition and Fees: $7500/year Health Insurance: $40/month Entertainment: $40/week Phone: $65/month a) What is the student's monthly income? b) What is the student's monthly expenses? c) What is the student's net monthly cash flow?arrow_forwardThe monthly payment p on a mortgage varies directly with the amount borrowed b. Suppose that you decide to borrow $190,000 using a 30-year mortgage at 4% interest. You are told that your monthly payment is $907.09. Write a linear function that relates the monthly payment p to the amount borrowed b for a mortgage with the same terms.arrow_forwardCan you help with parts d, e, and f please? The Admission director for a college far from mart and town believes that an inverse relationship exists between a private college's average discount rate(determined by the average amount of scholarships students receive) and the annual yield (the percentage of admitted students who actually attend). The Director's independent variable is a private college's discount rate measured as a percentage, and the dependent variable is the college's annual yield measured as a percentage. The following results were obtained for a sample of 30 private colleges: x- Discount rate(percentage) - range: 35 to 72 percent y- Annual Yield(percentage) - range: 12 o 81 percent Σxi = 1612 Σyi = 898Σxiyi = 44,377Σxi2 = 89,790Σyi2 = 35,704a. Calculate the sample regression line's slope estimate. Interpret the sample regression line's slope estimate.b. Calculate the sample regression line's intercept estimate. Interpret the sample regression line's intercept…arrow_forward
 College Algebra (MindTap Course List)AlgebraISBN:9781305652231Author:R. David Gustafson, Jeff HughesPublisher:Cengage Learning
 Algebra & Trigonometry with Analytic GeometryAlgebraISBN:9781133382119Author:SwokowskiPublisher:Cengage
 Glencoe Algebra 1, Student Edition, 9780079039897...AlgebraISBN:9780079039897Author:CarterPublisher:McGraw Hill
 Algebra: Structure And Method, Book 1AlgebraISBN:9780395977224Author:Richard G. Brown, Mary P. Dolciani, Robert H. Sorgenfrey, William L. ColePublisher:McDougal Littell
 Trigonometry (MindTap Course List)TrigonometryISBN:9781305652224Author:Charles P. McKeague, Mark D. TurnerPublisher:Cengage Learning
 Holt Mcdougal Larson Pre-algebra: Student Edition...AlgebraISBN:9780547587776Author:HOLT MCDOUGALPublisher:HOLT MCDOUGAL