
Concept explainers
Videos
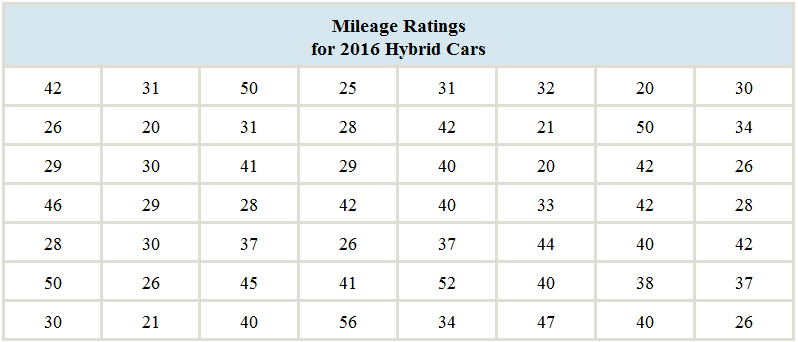
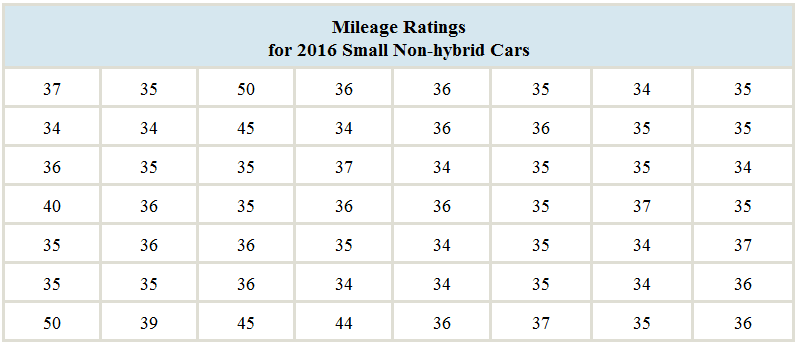
In the chapter introduction, we presented gas mileage data for 2016 model year hybrid and small non-hybrid cars. We will use histograms and back-to-back stem-and-leaf plots to compare the mileages between these two groups of cars. The following tables present the mileages, in miles per gallon.
Construct a back-to-back stem-and-leaf plot for these data, using two lines for each stem. Which do you think illustrates the comparison better, the histograms or the back-to-back stem-and-leaf plot? Why?
Compare the histogram for the hybrid cars with the histogram for the non-hybrid cars. For which cars do the mileages vary more?
To construct and compare:Thehistogramsfor the hybrid andnon-hybrid cars and the back-to-back stem-and-leaf plot for the given data.
Answer to Problem 9CS
Thebetter illustration of comparison is back-to-back stem-and-leaf.
Explanation of Solution
Given information:The gas mileage data for 2016 model year hybrid and small non-hybrid cars is given. The following tables present the mileages, in miles per gallon.
| Mileage Ratings for 2016 Hybrid cars | |||||||
| 42 | 31 | 50 | 25 | 31 | 32 | 20 | 30 |
| 26 | 20 | 31 | 28 | 42 | 21 | 50 | 34 |
| 29 | 30 | 41 | 29 | 40 | 20 | 42 | 26 |
| 46 | 29 | 28 | 42 | 40 | 33 | 42 | 28 |
| 28 | 30 | 37 | 26 | 37 | 44 | 40 | 42 |
| 50 | 26 | 45 | 41 | 52 | 40 | 38 | 37 |
| 30 | 21 | 40 | 56 | 34 | 47 | 40 | 26 |
| Mileage Ratings for 2016 Small Non-hybrid cars | |||||||
| 37 | 35 | 50 | 36 | 36 | 35 | 34 | 35 |
| 34 | 34 | 45 | 34 | 36 | 36 | 35 | 35 |
| 36 | 35 | 35 | 37 | 34 | 35 | 35 | 34 |
| 40 | 36 | 35 | 36 | 36 | 35 | 37 | 35 |
| 35 | 36 | 36 | 35 | 34 | 35 | 34 | 37 |
| 35 | 35 | 36 | 34 | 34 | 35 | 34 | 36 |
| 50 | 39 | 45 | 44 | 36 | 37 | 35 | 36 |
Definition used:Stem plot is a tool to visualize the shape of a distribution.
Calculation:
The back-to-back stem-and-leaf plot for the given data is given by
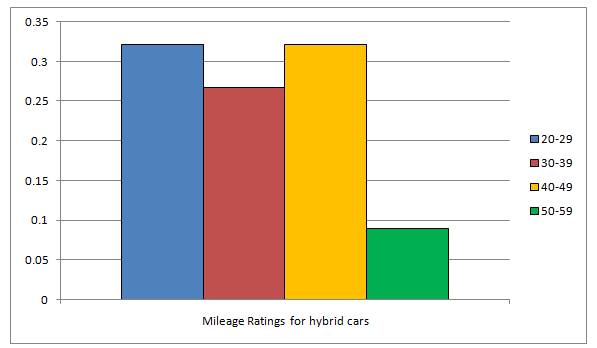
The table of relative frequency for hybrid cars is given by
| Class | Frequency | Relative frequency |
| 20-29 | 18 | 0.3214 |
| 30-39 | 15 | 0.2679 |
| 40-49 | 18 | 0.3214 |
| 50-59 | 5 | 0.0893 |
The relative frequency histogram for hybrid cars is given by
The table of relative frequency for non-hybrid cars is given by
| Class | Frequency | Relative frequency |
| 31-35 | 30 | |
| 36-40 | 21 | |
| 41-45 | 3 | |
| 46-50 | 2 |
The relative frequency histogram for non-hybrid cars is given by
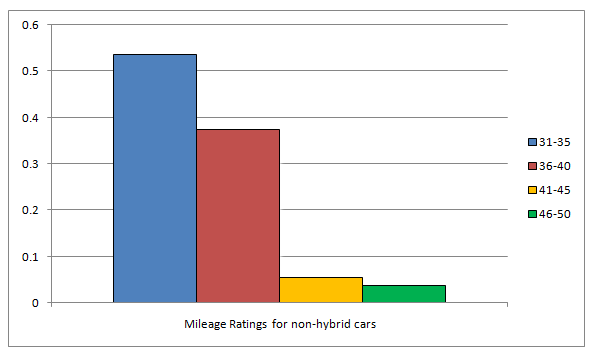
From the above two histograms and back-to-back stem-and-leaf plot, the better illustration of comparison is back-to-back stem-and-leaf because it will give a quick visualized comparison of the data by looking the shape of the distribution.
Want to see more full solutions like this?
Chapter 2 Solutions
Elementary Statistics 2nd Edition


- A company found that the daily sales revenue of its flagship product follows a normal distribution with a mean of $4500 and a standard deviation of $450. The company defines a "high-sales day" that is, any day with sales exceeding $4800. please provide a step by step on how to get the answers in excel Q: What percentage of days can the company expect to have "high-sales days" or sales greater than $4800? Q: What is the sales revenue threshold for the bottom 10% of days? (please note that 10% refers to the probability/area under bell curve towards the lower tail of bell curve) Provide answers in the yellow cellsarrow_forwardFind the critical value for a left-tailed test using the F distribution with a 0.025, degrees of freedom in the numerator=12, and degrees of freedom in the denominator = 50. A portion of the table of critical values of the F-distribution is provided. Click the icon to view the partial table of critical values of the F-distribution. What is the critical value? (Round to two decimal places as needed.)arrow_forwardA retail store manager claims that the average daily sales of the store are $1,500. You aim to test whether the actual average daily sales differ significantly from this claimed value. You can provide your answer by inserting a text box and the answer must include: Null hypothesis, Alternative hypothesis, Show answer (output table/summary table), and Conclusion based on the P value. Showing the calculation is a must. If calculation is missing,so please provide a step by step on the answers Numerical answers in the yellow cellsarrow_forward
 Glencoe Algebra 1, Student Edition, 9780079039897...AlgebraISBN:9780079039897Author:CarterPublisher:McGraw Hill
 Holt Mcdougal Larson Pre-algebra: Student Edition...AlgebraISBN:9780547587776Author:HOLT MCDOUGALPublisher:HOLT MCDOUGAL
 Big Ideas Math A Bridge To Success Algebra 1: Stu...AlgebraISBN:9781680331141Author:HOUGHTON MIFFLIN HARCOURTPublisher:Houghton Mifflin Harcourt
 Functions and Change: A Modeling Approach to Coll...AlgebraISBN:9781337111348Author:Bruce Crauder, Benny Evans, Alan NoellPublisher:Cengage Learning
 College Algebra (MindTap Course List)AlgebraISBN:9781305652231Author:R. David Gustafson, Jeff HughesPublisher:Cengage Learning