
Concept explainers
Videos
a.
To calculate: The dollar sales of ice cream in two years, based on the regression equation treating ice cream sales as the dependent variable and time as the independent variable
Introduction: Regression analysis is a statistical method for estimating the interactions between variables. In data
a.
Answer to Problem 54AP
The dollar sales of ice cream in two years:
Explanation of Solution
| Month | Park Attendies | Ice cream sales | ||
| 1 | 880 | 325 | 286,000 | 77,440 |
| 2 | 976 | 335 | 326,926 | 95,576 |
| 3 | 440 | 172 | 75,680 | 193,600 |
| 4 | 1,823 | 645 | 1,175,835 | 3,323,329 |
| 5 | 1,885 | 770 | 1,451,450 | 3,553,225 |
| 6 | 2,436 | 950 | 2,314,200 | 5,934,096 |
| Total = 21 | 8440 | 3197 | 5,630,125 | 13,177,266 |
Substituting the values in equation (1)
Calculating general regression using the following equations:
Now,
Calculating the regression equation below:
The forecast predicted does not seem confident enough to assume as the trend observed over the first six months might be unlikely for the next six months of the year.
b.
To calculate: A regression equation treating ice cream sales as the dependent variable and part attendees as the independent variable
Introduction: Regression analysis is a statistical method for estimating the interactions between variables. In data forecasting, companies can learn trends using regression analysis. It enables data based predictions to be made.
b.
Answer to Problem 54AP
Explanation of Solution
| Month | Park Attendies | Ice cream sales | ||
| 1 | 880 | 325 | 286,000 | 77,440 |
| 2 | 976 | 335 | 326,926 | 95,576 |
| 3 | 440 | 172 | 75,680 | 193,600 |
| 4 | 1,823 | 645 | 1,175,835 | 3,323,329 |
| 5 | 1,885 | 770 | 1,451,450 | 3,553,225 |
| 6 | 2,436 | 950 | 2,314,200 | 5,934,096 |
| Total = 21 | 8440 | 3197 | 5,630,125 | 13,177,266 |
Substituting the values in equation (3)
Calculating general regression using the following equations:
Now,
c.
To calculate: Ice cream sales for months 12 through 18, based on the curve and the regression equation determined in part (b)
Introduction: Regression analysis is a statistical method for estimating the interactions between variables. In data forecasting, companies can learn trends using regression analysis. It enables data based predictions to be made.
c.
Answer to Problem 54AP
Explanation of Solution
The following logistic curve can be considered for obtaining values:
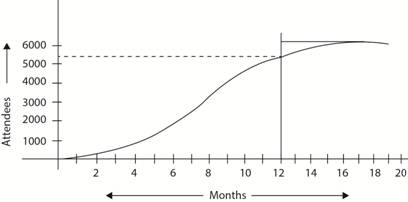
The number of attendies observed from the logistic curve from months 12 to 18 until peak 3000 is shown below:
| MONTH | ATTENDIES | PREDICTED ICE CREAM SALES |
| 12 | 5100 | 1995.39 |
| 13 | 5350 | 2094.39 |
| 14 | 5600 | 2193.39 |
| 15 | 5800 | 2272.59 |
| 16 | 5900 | 2312.19 |
| 17 | 5950 | 2331.99 |
| 18 | 5980 | 2343.87 |
Using the regression equation
Want to see more full solutions like this?
Chapter 2 Solutions
Production and Operations Analysis, Seventh Edition


- Say women on average take twice as long in the restroom (not including waiting times) than men. Is the 2:1 ration for flushing capacity the right ratio?arrow_forwardTo what extent does the equation for the waiting time in the queue help explain why queues for the Women's room might be longer than queues for the Men's room before 2005 in New York City?arrow_forwardBesides adding flushing capacity for the women's bathrooms versus men's bathrooms, what can be done to reduce waiting time for the restrooms?arrow_forward
- How does rework hurt a process? Give examples on how rework can hurt a process. Please provide a referencearrow_forwardHow does rework hurt a process? Give examples on how rework can hurt a process. Please provide a referencearrow_forwardWhat the different between a near miss and hazard 1. movement and contact 2. Contact 3. movementarrow_forward
- The fixed and variable costs for three potential manufacturing plant sites for a rattan chair weaver are shown: Site Fixed Cost Per Year Variable Cost per Unit 1 $700 $12.00 2 $1,000 $7.00 $2,200 $5.00 a) After rounding to the nearest whole number, site 1 is best below After rounding to the nearest whole number, site 2 is best between After rounding to the nearest whole number, site 3 is best above b) If the demand is 590 units, then the best location for the potent 3 units. and units. 600 0 60 units. g plant isarrow_forwardRefer to Table S6.1 - Factors for Computing Control Chart Limits (3 sigma) for this problem. Sampling 4 pieces of precision-cut wire (to be used in computer assembly) every hour for the past 24 hours has produced the following results: Hour R Hour X R Hour X R Hour X R 1 3.25" 0.71" 7 3.15" 0.58" 13 3.11" 0.85" 19 4.51" 1.56" 2 3.20 1.18 8 2.65 1.08 14 2.83 1.31 20 2.79 1.14 3 3.12 1.38 9 15 4. 3.39 1.31 10 5 2.97 1.17 6 2.76 0.32 3.02 0.71 3.12 1.01 2.75 1.33 16 2.74 0.50 22 11 2.73 1.17 17 2.76 1.43 23 12 2.87 0.45 18 2.64 1.24 21 2.75 1.03 3.18 0.46 2.94 1.53 24 2.54 0.97 Based on the sampling done, the control limits for 3-sigma x chart are (round all intermediate calculations to three decimal places before proceeding with further calculations): Upper Control Limit (UCL) = inches (round your response to three decimal places). Lower Control Limit (LCL) = inches (round your response to three decimal places). Based on the x-chart, the wire cutting process has been The control limits…arrow_forwardChoose a specific cars company. E.g Toyota, Volkswagen, Hyundai, Mercedes-Benz, BMW, Honda, Ford, Audi, Tesla Define a list of required machinery, equipment, workstations, offices, rest areas, materials, etc. Develop and define the location of machinery, equipment, workstations, offices, rest areas, materials. Make the distribution in the manufacturing facility the most efficient way possible. Develop a process distribution for one specific product. Explain why you consider this is the most efficient distribution for this specific manufacturing facility. demonstrate the benefits of optimizing a production line with the best distribution of its equipment and spaces. To be more productive and profitable.arrow_forward
- Provide a Synposis of the Articlearrow_forwardThe goal of understanding personality in negotiation is to better predict behavior, such as the counterparty's acceptance or rejection of a negotiation offer. One investigation used acoustic and visual cues to predict the likely behavior of a counterparty to a proposal. The best visual cue predictor of the counterparty (55%) was whether they _____. A. tilted their head B. had their arms and legs crossed C. steepled their fingers D. tapped a penarrow_forwardWomen who ask for what they want in negotiation are less well-liked than women who do not self-advocate. However, nonassertive, other-advocating women suffer a leadership backlash and are regarded as less competent because their behavior is regarded to be _____ and _____. A. high-negative feminine; low-positive masculine B. high-positive feminine; high-positive masculine C. high-negative masculine; low-negative feminine D. low-positive masculine; low-positive femininearrow_forward
 Practical Management ScienceOperations ManagementISBN:9781337406659Author:WINSTON, Wayne L.Publisher:Cengage,
 Contemporary MarketingMarketingISBN:9780357033777Author:Louis E. Boone, David L. KurtzPublisher:Cengage Learning
 MarketingMarketingISBN:9780357033791Author:Pride, William MPublisher:South Western Educational Publishing