
Videos
Cincinnati, Ohio, also known as the Queen City, has a population of approximately 298,000 and is the third largest city in the state of Ohio. The Cincinnati metropolitan area has a population of about 2.2 million. The city is governed by a mayor and a nine-member city council. The city manager, who is responsible for the day-to-day operation of the city, reports to the mayor and city council. The city manager recently created the Office of Performance and Data Analytics with the goal of improving the efficiency of city operations. One of the first tasks of this new office is to review the previous year’s expenditures. The file QueenCity contains data on the previous year’s expenditures, including the following:
Department: The number of the department incurring the expenditure
Department Description: The name of the department incurring the description
Category: The category of the expenditure
Fund: The fund to which the expenditure was charged
Expenditure: The dollar amount of the expense
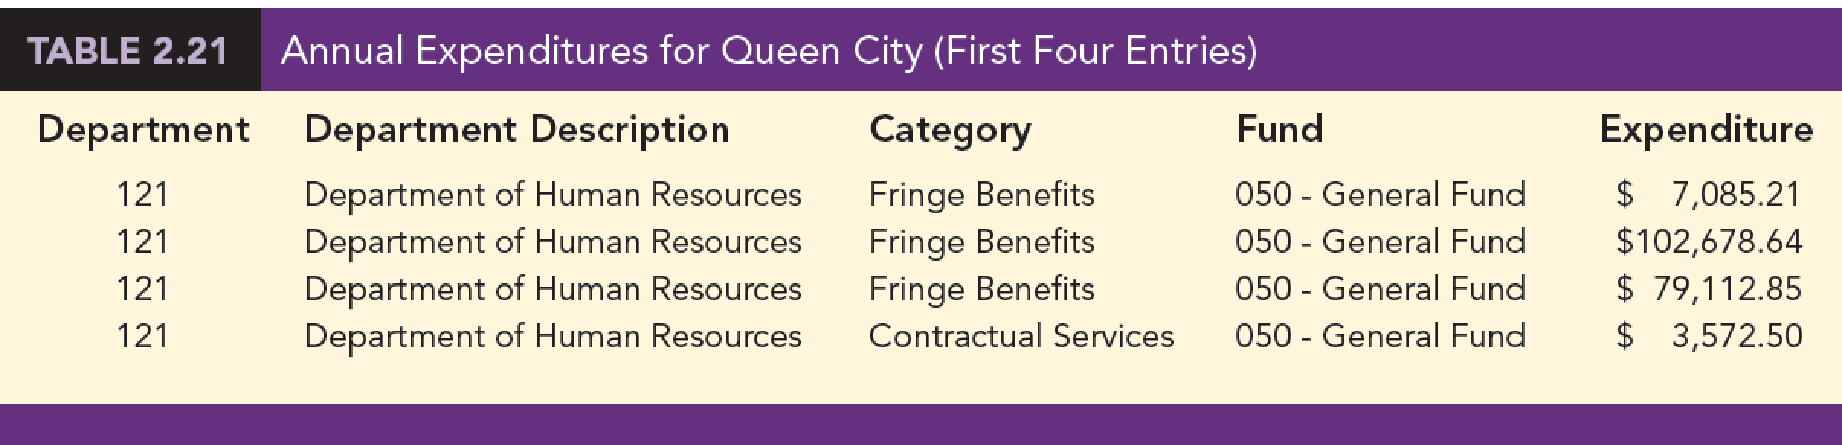
Table 2.21 shows the first four entries of the 5427 expenditures for the year. The city manager would like to use this data to better understand how the city’s budget is being spent.
Manageri al Report
Use tabular and graphical methods of
- 1. Tables and/or graphical displays that show the amount of expenditures by category and percentage of total expenditures by category.
- 2. A table that shows the amount of expenditures by department and the percentage of total expenditures by department. Combine any department with less than 1% into a category named “Other.”
- 3. A table that shows the amount of expenditures by fund and the percentage of total expenditures by fund. Combine any fund with less than 1% into a category named “Other.”
1.
Make tabular and graphical displays that show the amount of expenditure by category and percentage of total expenditures by category.
Answer to Problem 3CP
The following table represents the total amount of expenditure by category and percentage of total expenditures by category:
| Category | Total expenditure | Percentage of total expenditure |
| Capital | $198,365,854 | 29.98% |
| Payroll | $145,017,555 | 21.92% |
| Debt service | $86,913,978 | 13.14% |
| Contractual services | $85,043,249 | 12.85% |
| Fringe benefits | $66,053,340 | 9.98% |
| Fixed costs | $53,732,177 | 8.12% |
| Materials and supplies | $19,934,710 | 3.01% |
| Inventory | $6,393,394 | 0.97% |
| Payables | $180,435 | 0.03% |
| Grand Total | $661,634,693 | 100.0% |
The bar chart for “Category” is given below:

Explanation of Solution
Calculation:
The table represents the sample of 5,427 entries and the annual expenditures for queen city (City C and City O) for the year. The five types of variables present in the data are department serial number, department description, category name, fund, and expenditure.
From the data set, the variable “Category” consists of nine entities, namely capital, payroll, debt service, contractual services, fringe benefits, fixed costs, materials and supplies, inventory, and payable.
Therefore, the following table shows the amount of all nine entities’ total expenditure by category:
| Category | Total expenditure |
| Capital | $198,365,854 |
| Payroll | $145,017,555 |
| Debt service | $86,913,978 |
| Contractual services | $85,043,249 |
| Fringe benefits | $66,053,340 |
| Fixed costs | $53,732,177 |
| Materials and supplies | $19,934,710 |
| Inventory | $6,393,394 |
| Payables | $180,435 |
| Grand Total | $661,634,693 |
The percentage for capital is calculated as the ratio of total expenditure for capital to the grand totals of all categories.
The following table shows the percentage of amount of all nine entities’ total expenditure by category:
| Category | Total expenditure | Percentage of total expenditure |
| Capital | $198,365,854 | 29.98% |
| Payroll | $145,017,555 | 21.92% |
| Debt service | $86,913,978 | 13.14% |
| Contractual services | $85,043,249 | 12.85% |
| Fringe benefits | $66,053,340 | 9.98% |
| Fixed costs | $53,732,177 | 8.12% |
| Materials and supplies | $19,934,710 | 3.01% |
| Inventory | $6,393,394 | 0.97% |
| Payables | $180,435 | 0.03% |
| Grand Total | $661,634,693 | 100.0% |
Software procedure:
Step-by-step software procedure to obtain the bar chart for category using EXCEL software:
- In Excel sheet, enter Category in one column and Percentage of total Expenditure in another column.
- Select the data, and then choose Insert > Insert Column Bar Charts.
- Select Clustered Column under More Column Charts.
Output using the EXCEL software is given below:
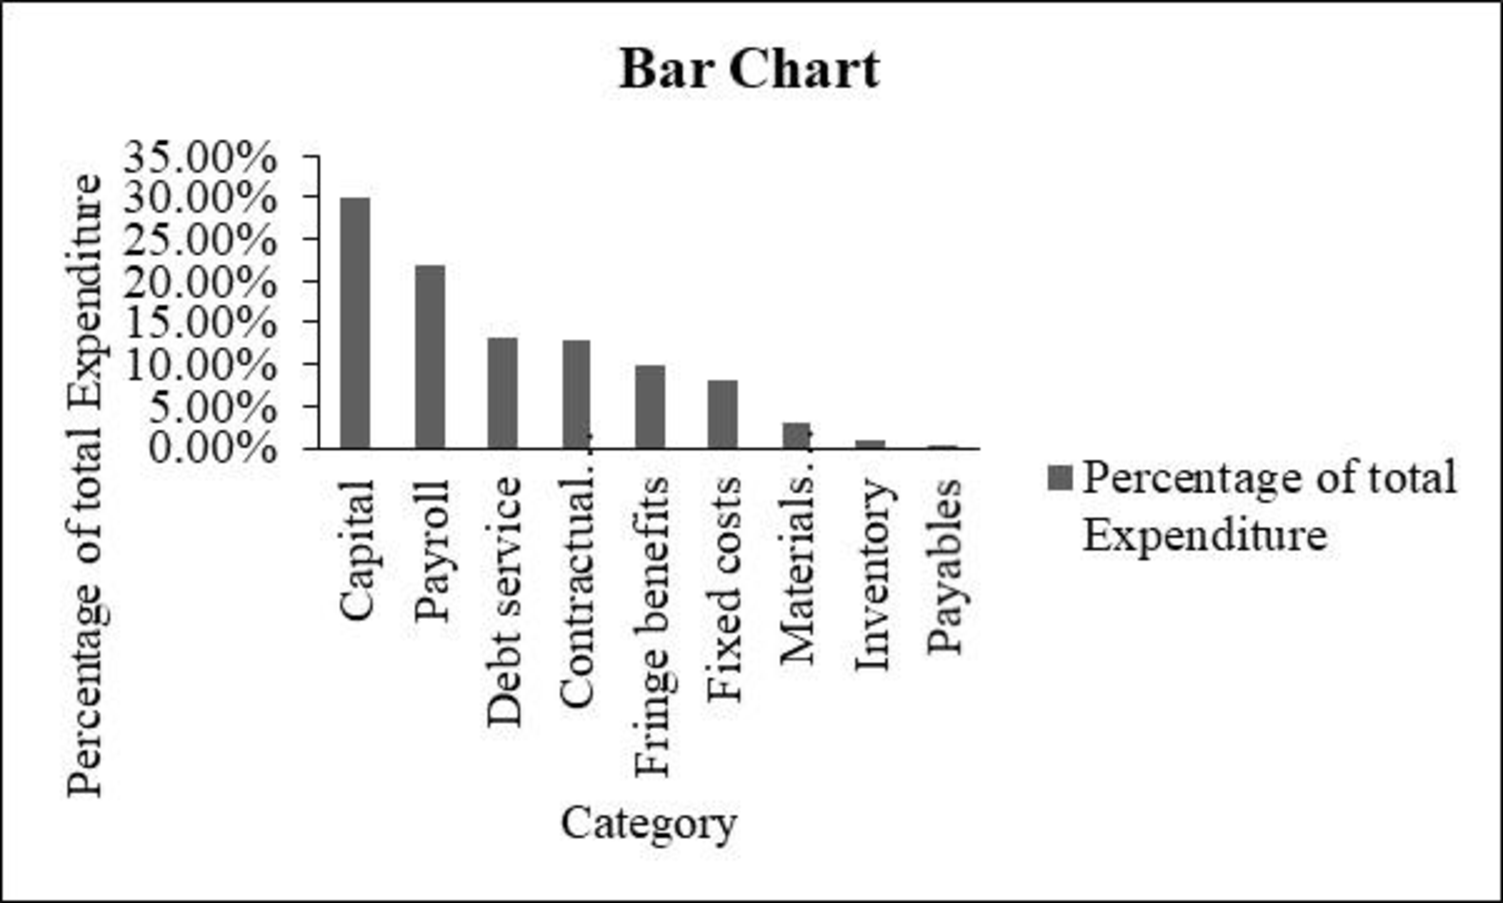
From the obtained table and bar chart, it can be observed that the sum of capital expenditures and payroll contributes 50% of all expenditures.
Also, the total expenditures are over $660 million. Debt service seems to be high, and it is found to be over 10% of total expenditures.
2.
Make tabular displays that show the amount of expenditure by department and percentage of total expenditures by department.
Answer to Problem 3CP
The following table represents the total amount of expenditure by department and percentage of total expenditures by department:
| Department description | Percentage of total expenditure | Total expenditure |
| Department of Police | 9.72% | 64,295,941 |
| Department of Sewers | 8.76% | 57,954,955 |
| Transportation and Engineering | 8.72% | 57,686,199 |
| Department of Fire | 7.23% | 47,838,396 |
| Sewers, Debt Service | 6.59% | 43,585,814 |
| Finance, Risk Management | 5.39% | 35,654,238 |
| SORTA Operations | 3.62% | 23,975,000 |
| Water Works, Debt Service | 3.24% | 21,418,102 |
| Department of Water Works | 3.07% | 20,307,505 |
| Finance, Treasury | 2.80% | 18,531,650 |
| Economic Development | 2.13% | 14,078,735 |
| Division of Parking Facilities | 1.89% | 12,489,731 |
| Community Development, Housing | 1.75% | 11,556,943 |
| Enterprise Technology Solutions | 1.71% | 11,314,215 |
| Public Services, Fleet Services | 1.66% | 10,982,312 |
| Finance, Accounts & Audits | 1.66% | 10,960,345 |
| Transportation and Engineering, Planning | 1.63% | 10,764,138 |
| Public Services, Neighborhood Operations | 1.38% | 9,140,769 |
| Sewers, Millcreek | 1.30% | 8,575,226 |
| Health, Primary Health Care Centers | 1.25% | 8,268,632 |
| Water Works, Water Supply | 1.19% | 7,883,099 |
| Public Services, Facilities Management | 1.13% | 7,469,863 |
| Sewers, Wastewater Administration | 1.01% | 6,668,240 |
| Other department less than 1 percent each | 21.2% | 140,234,644 |
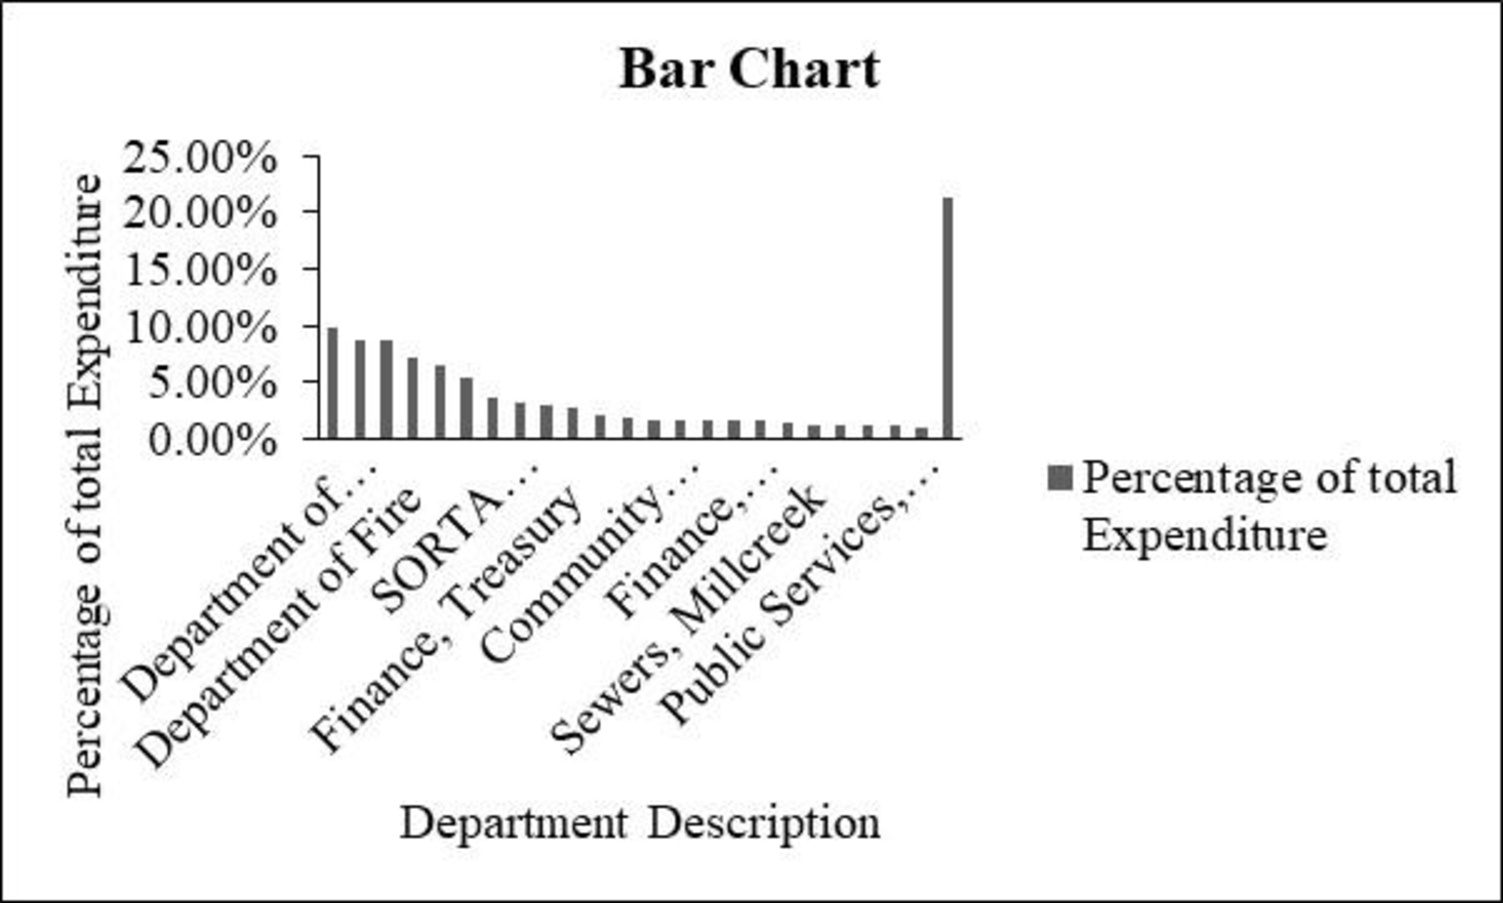
The bar chart for “Department description” is given below:
Explanation of Solution
Calculation:
Here, any departments with less than 1% are combined into a category named “other”.
Department description with less than 1% is tabulated as follows and named as “other”:
| Other (department description less than 1%) | Percentage of total expenditure | Total expenditure |
| Water Works, Distribution | 0.98% | 6,490,554 |
| Public Services, Traffic and Road Operations | 0.89% | 5,884,799 |
| Parks, Administrative and Program Services | 0.87% | 5,744,316 |
| Water Works, Commercial Services | 0.81% | 5,360,380 |
| Sewers, Wastewater Collection | 0.81% | 5,331,756 |
| Sewers, Director/Storm water | 0.79% | 5,213,170 |
| Parks, Operations and Facility Mgmt | 0.76% | 5,008,200 |
| Police Emergency Communications | 0.69% | 4,557,589 |
| Division of Convention Center | 0.67% | 4,460,267 |
| Health, Primary Health Care Programs | 0.58% | 3,821,334 |
| Health, Community Health Services | 0.56% | 3,675,649 |
| Sewers, Maintenance | 0.55% | 3,668,040 |
| Water Works, Water Quality and Treatment | 0.51% | 3,395,988 |
| Recreation, Support Services | 0.50% | 3,315,938 |
| Law Department | 0.47% | 3,078,594 |
| Recreation, Golf | 0.42% | 2,781,652 |
| Water Works, Business Services | 0.41% | 2,693,873 |
| New Construction & Building Standards | 0.40% | 2,677,798 |
| Water Works, Engineering | 0.39% | 2,583,805 |
| Division of Traffic Engineering | 0.38% | 2,504,453 |
| Cincinnati Public School Reserve | 0.38% | 2,500,000 |
| Sewers, Little Miami | 0.37% | 2,439,869 |
| Planning, Licenses & Permits | 0.36% | 2,371,973 |
| Workers' Compensation Insurance | 0.33% | 2,214,094 |
| Motorized and Construction Equipment | 0.33% | 2,187,298 |
| Recreation, Maintenance | 0.33% | 2,162,545 |
| General Fund Overhead | 0.32% | 2,095,756 |
| Health, Primary School &Adolescent | 0.31% | 2,074,254 |
| Community Development Administration | 0.30% | 1,968,773 |
| Sewers, Industrial Waste | 0.28% | 1,841,374 |
| Office of the City Manager | 0.26% | 1,712,437 |
| Sewers, Project Delivery | 0.25% | 1,682,688 |
| Finance, Purchasing | 0.24% | 1,600,148 |
| Recreation, Athletics | 0.24% | 1,582,290 |
| Office of Environmental Qualities | 0.23% | 1,548,437 |
| Recreation, West Region | 0.22% | 1,487,931 |
| Finance, Income Tax | 0.22% | 1,483,479 |
| Health, Commissioner | 0.21% | 1,418,825 |
| Recreation, Central Region | 0.21% | 1,393,663 |
| Recreation, East Region | 0.20% | 1,350,682 |
| Community Development | 0.20% | 1,337,001 |
| Sewers, Muddy Creek | 0.18% | 1,211,584 |
| Health, Technical Resources | 0.17% | 1,122,229 |
| Sewers, Planning | 0.17% | 1,092,095 |
| Enterprise Software and Licenses | 0.16% | 1,082,024 |
| Water Works, IT | 0.16% | 1,039,488 |
| Sewers, Wastewater Engineering | 0.15% | 973,882 |
| Department of Human Resources | 0.14% | 929,460 |
| Department Of Planning & Buildings | 0.14% | 911,988 |
| Office and Technical Equipment | 0.13% | 863,762 |
| Bond Fund — Principal and Interest | 0.12% | 774,523 |
| Sewers, Sycamore | 0.11% | 754,132 |
| Transportation and Engineering Director | 0.11% | 720,092 |
| Division of Aviation | 0.11% | 702,480 |
| Budget & Evaluation | 0.08% | 562,270 |
| Sewers, Polk Run | 0.08% | 532,890 |
| Sewers, Taylor Creek | 0.08% | 529,774 |
| Citizens' Complaint Authority | 0.07% | 431,449 |
| Sewers, Superintendent | 0.06% | 428,268 |
| Contribution to Fire Pension | 0.06% | 416,783 |
| Contribution to Police Pension | 0.06% | 400,439 |
| Public Services, Director | 0.06% | 397,815 |
| Port Authority Greater Cincinnati Development | 0.05% | 350,000 |
| City Council | 0.05% | 337,658 |
| Hamilton Co. Auditor & Treasurer Fees | 0.05% | 298,758 |
| Office of The Clerk of Council | 0.04% | 293,185 |
| Office of The Mayor | 0.04% | 287,622 |
| Lump Sum Payments | 0.04% | 252,054 |
| Finance Director’s Office | 0.03% | 213,548 |
| County Clerk Fees | 0.03% | 175,000 |
| Public Employees Assistance Program | 0.02% | 161,711 |
| Police and Fire Fighter's Insurance | 0.02% | 115,000 |
| Parks, Office of Director | 0.01% | 94,987 |
| Special Investigations/Studies | 0.01% | 92,210 |
| Councilmember PG Sittenfeld | 0.01% | 77,451 |
| Surplus | 0.01% | 76,091 |
| Councilmember Y. Simpson | 0.01% | 70,985 |
| Councilmember W. Young | 0.01% | 63,012 |
| Councilmember R. Qualls | 0.01% | 62,862 |
| Councilmember C. Seelbach | 0.01% | 60,177 |
| Councilmember Quinlivan | 0.01% | 57,685 |
| Councilmember C. Winburn | 0.01% | 57,654 |
| Downtown Special Improvement District | 0.01% | 56,000 |
| Memberships & Publications | 0.01% | 53,150 |
| Cincinnati Music Hall | 0.01% | 50,000 |
| Election Expense | 0.01% | 46,580 |
| Convention Facility Authority | 0.01% | 45,700 |
| Councilmember C. Thomas | 0.01% | 45,603 |
| Councilmember C. Smitherman | 0.01% | 43,141 |
| Mayor's Office Obligations | 0.01% | 41,194 |
| State Unemployment Comp | 0.00% | 31,671 |
| Manager's Office Obligations | 0.00% | 13,956 |
| Councilmember P. Thomas | 0.00% | 13,168 |
| Judgments Against the City | 0.00% | 7,644 |
| Department of Public Recreation | 0.00% | 5,093 |
| Audit & Examiners Fees | 0.00% | 5,000 |
From the data set, the variable “department description” has 119 different departments, out of which 96 departments’ percentage is less than 1.
Therefore, the following table shows the expenditure of all 119 different departments:
| Department description | Total expenditure |
| Department of Police | 64,295,941 |
| Department of Sewers | 57,954,955 |
| Transportation and Engineering | 57,686,199 |
| Department of Fire | 47,838,396 |
| Sewers, Debt Service | 43,585,814 |
| Finance, Risk Management | 35,654,238 |
| SORTA Operations | 23,975,000 |
| Water Works, Debt Service | 21,418,102 |
| Department of Water Works | 20,307,505 |
| Finance, Treasury | 18,531,650 |
| Economic Development | 14,078,735 |
| Division of Parking Facilities | 12,489,731 |
| Community Development, Housing | 11,556,943 |
| Enterprise Technology Solutions | 11,314,215 |
| Public Services, Fleet Services | 10,982,312 |
| Finance, Accounts & Audits | 10,960,345 |
| Transportation and Engineering, Planning | 10,764,138 |
| Public Services, Neighborhood Operations | 9,140,769 |
| Sewers, Millcreek | 8,575,226 |
| Health, Primary Health Care Centers | 8,268,632 |
| Water Works, Water Supply | 7,883,099 |
| Public Services, Facilities Management | 7,469,863 |
| Sewers, Wastewater Administration | 6,668,240 |
| Other department less than 1 percent each | 140,234,644 |
| Grand Total | 661,634,692 |
The percentage for department description is calculated as the ratio of total expenditure to the grand total of all departments.
Therefore, the following table shows the percentage of amount of all department total expenditure by department:
| Department description | Percentage of total expenditure |
| Department of Police | 9.72% |
| Department of Sewers | 8.76% |
| Transportation and Engineering | 8.72% |
| Department of Fire | 7.23% |
| Sewers, Debt Service | 6.59% |
| Finance, Risk Management | 5.39% |
| SORTA Operations | 3.62% |
| Water Works, Debt Service | 3.24% |
| Department of Water Works | 3.07% |
| Finance, Treasury | 2.80% |
| Economic Development | 2.13% |
| Division of Parking Facilities | 1.89% |
| Community Development, Housing | 1.75% |
| Enterprise Technology Solutions | 1.71% |
| Public Services, Fleet Services | 1.66% |
| Finance, Accounts & Audits | 1.66% |
| Transportation and Engineering, Planning | 1.63% |
| Public Services, Neighborhood Operations | 1.38% |
| Sewers, Millcreek | 1.30% |
| Health, Primary Health Care Centers | 1.25% |
| Water Works, Water Supply | 1.19% |
| Public Services, Facilities Management | 1.13% |
| Sewers, Wastewater Administration | 1.01% |
| Other department less than 1 percent each | 21.2% |
Software procedure:
Step-by-step software procedure to obtain bar chart for department using EXCEL software:
- In Excel sheet, enter Department Description in one column and Percentage of total Expenditure in another column.
- Select the data, and then choose Insert > Insert Column Bar Charts.
- Select Clustered Column under More Column Charts.
Output using the Excel is given below:

Interpretation:
- From the obtained table and bar chart, it can be observed that 96 departments are showing total expenditure less than 1% over 119 departments.
- There are six individual departments, namely police, sewers, transportation and engineering, fire, sewer debt service, and financial/risk management, They have the total expenditure approximately 5 percent and more.
- Further, other department less than 1 percent each seems to be high, in terms of total expenditure percentage.
3.
Make tabular displays that show the amount of expenditure by fund and percentage of total expenditures by fund and combine any department with less than 1% into a category named “other”.
Answer to Problem 3CP
The following table represents the total amount of expenditure by fund and percentage of total expenditures by fund:
| Fund | Total expenditure | Percentage of total expenditure |
| 050 - general fund | 168,607,659 | 25.5% |
| 980 - capital projects | 106,180,470 | 16.0% |
| 701 - metropolitan sewer district of greater Cincinnati | 83,713,741 | 12.7% |
| 704 - metropolitan sewer district capital improvements | 57,954,955 | 8.8% |
| 101 - water works | 52,292,202 | 7.9% |
| 711 - risk management | 32,380,425 | 4.9% |
| 759 - income tax - transit | 24,239,259 | 3.7% |
| 151 - bond retirement - city | 15,584,916 | 2.4% |
| 202 - fleet services | 10,994,649 | 1.7% |
| 898 - water works improvement 12 | 8,483,304 | 1.3% |
| 897 - water works improvement 11 | 8,434,379 | 1.3% |
| 302 - income tax - infrastructure | 7,102,773 | 1.1% |
| other (less than 1% each) | 8,56,65,960 | 12.9% |
| Grand Total | 661,634,693 | 100.0% |
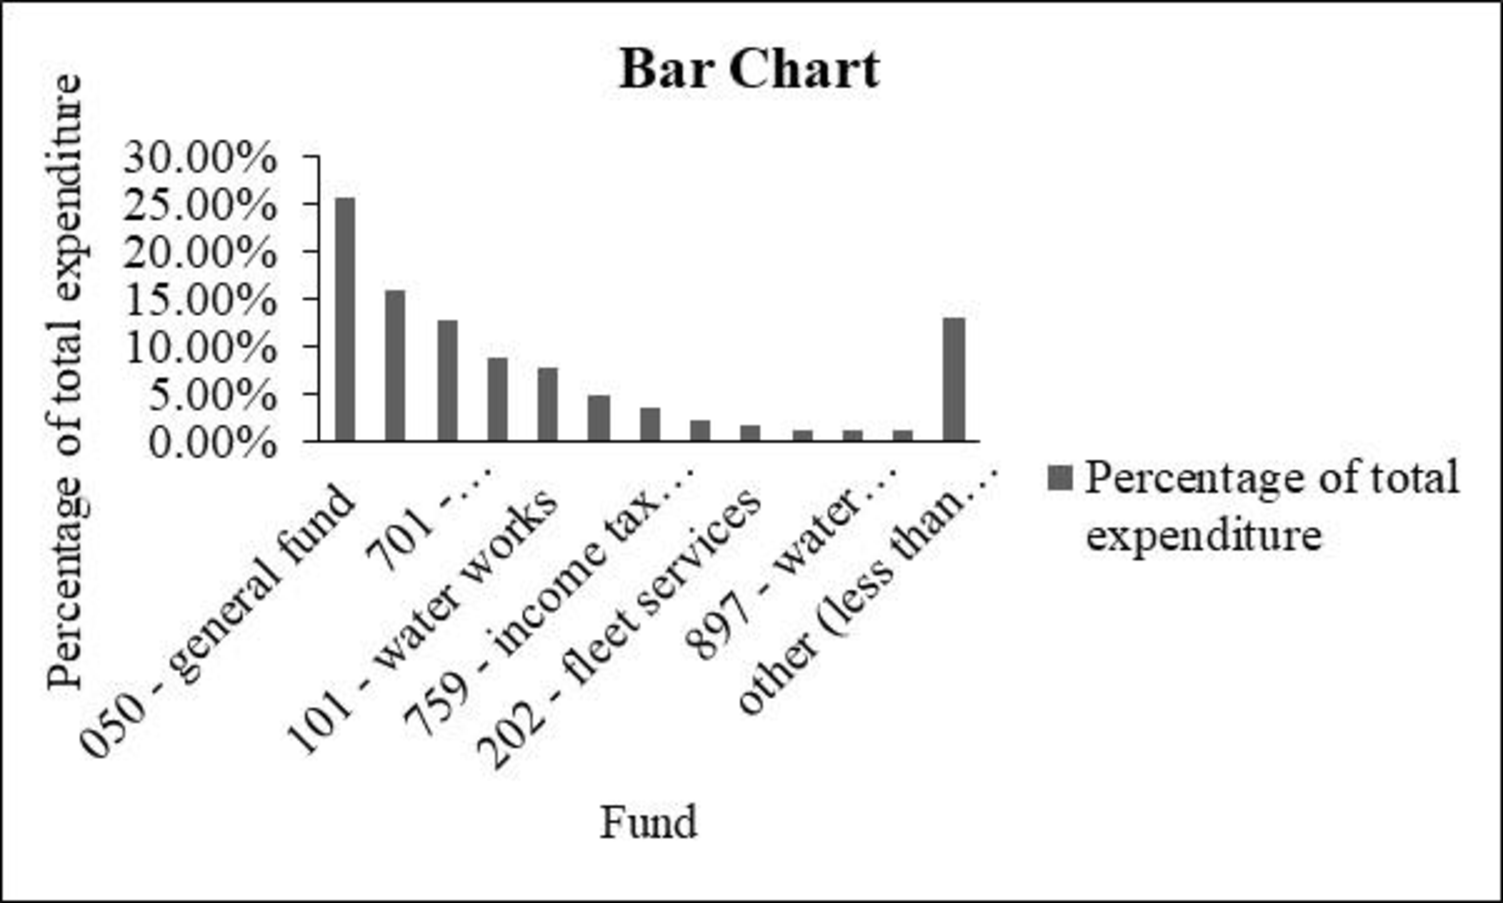
The bar chart for “Fund” is given below:
Explanation of Solution
Calculation:
Fund with less than 1% is tabulated below and named as “other”:
| Other (Fund less than 1%) | Total expenditure | Percentage of total expenditure |
| 155 – u square revenue bonds -trustee | 4,748,810 | 0.80% |
| 304 - community development block grant | 4,696,312 | 0.70% |
| 301 - street construction, maintenance and repair | 4,053,506 | 0.70% |
| 103 - duke energy convention center | 3,508,157 | 0.60% |
| 102 - parking system facilities | 3,388,305 | 0.50% |
| 702 - enterprise technology solutions | 3,216,237 | 0.50% |
| 762 - urban redevelopment tax increment equivalent | 2,816,029 | 0.50% |
| 105 - municipal golf activities | 2,596,303 | 0.40% |
| 395 - health services | 2,411,634 | 0.40% |
| 107 – storm water management | 2,325,888 | 0.40% |
| 368 - law enforcement grant | 2,222,595 | 0.40% |
| 410 - shelter plus care program | 2,162,535 | 0.30% |
| 449 - Cincinnati area’s geographic information system (cagis) | 2,159,283 | 0.30% |
| 353 - home health services | 2,099,548 | 0.30% |
| 457 - clear fund | 1,957,914 | 0.30% |
| 213 - worker's compensation | 1,817,200 | 0.30% |
| 758 - income tax permanent improvement fund | 1,766,123 | 0.30% |
| 214 - water works stores - chemicals | 1,526,281 | 0.30% |
| 204 - water works stores - materials | 1,506,447 | 0.20% |
| 391 - women and infants food grant program | 1,426,434 | 0.20% |
| 472 - fire grants | 1,362,498 | 0.20% |
| 307 - convention center expansion tax | 1,296,800 | 0.20% |
| 212 - employee safety and risk management | 1,216,265 | 0.20% |
| 491 - municipal public improvement equivalent fund | 1,212,813 | 0.20% |
| 438 - neighborhood stabilization program | 1,211,603 | 0.20% |
| 795 - downtown special improvement district | 1,202,786 | 0.20% |
| 201 - printing services/ stores | 1,141,805 | 0.20% |
| 306 - municipal motor vehicle license tax | 1,077,283 | 0.20% |
| 323 - recreation special activities | 1,069,119 | 0.20% |
| 411 - home investment trust | 991,223 | 0.20% |
| 349 - urban renewal debt retirement | 979,853 | 0.10% |
| 350 - public health research | 851,919 | 0.10% |
| 418 - federal health program income | 848,578 | 0.10% |
| 792 - forestry | 740,592 | 0.10% |
| 340 - centennial operations | 724,704 | 0.10% |
| 757 - miscellaneous permanent improvement fund | 662,729 | 0.10% |
| 104 - lunken airport | 586,663 | 0.10% |
| 487 - cuf/heights equivalent fund | 562,261 | 0.10% |
| 483 - downtown/otr east equivalent fund | 558,694 | 0.10% |
| 156 - fountain square west revenue bonds - trustee | 557,577 | 0.10% |
| 412 - food service license fees | 550,645 | 0.10% |
| 369 - criminal activity forfeiture - state | 523,925 | 0.10% |
| 488 –Coryville equivalent fund | 519,767 | 0.10% |
| 502 - arra federal grants | 509,814 | 0.10% |
| 445 - emergency shelter | 453,541 | 0.10% |
| 465 - housing opportunities for persons with aids | 373,929 | 0.10% |
| 498 –Madisonville equivalent fund | 363,449 | 0.10% |
| 332 - krohn conservatory | 302,862 | 0.10% |
| 364 - 911 cell phone fees | 299,652 | 0.00% |
| 381 - Cincinnati abatement project | 284,022 | 0.00% |
| 317 - urban development - property operations | 228,247 | 0.00% |
| 461 - fema grant | 219,424 | 0.00% |
| 793 - boulevard light energy and maintenance (blem) | 183,378 | 0.00% |
| 324 - recreation federal grant projects | 178,387 | 0.00% |
| 166 - greeters revenue bonds - trustee | 176,113 | 0.00% |
| 326 - park donations and special activity | 171,770 | 0.00% |
| 210 - highway maintenance stores | 169,814 | 0.00% |
| 342 - new city buildings operations | 167,023 | 0.00% |
| 420 - public employee assistance program | 165,141 | 0.00% |
| 446 - health network | 164,337 | 0.00% |
| 209 - property management | 162,435 | 0.00% |
| 618 - towing charges - private operators | 150,000 | 0.00% |
| 314 - special events | 146,679 | 0.00% |
| 481 - downtown south/riverfront equivalent fund | 144,066 | 0.00% |
| 367 - criminal activity forfeiture - federal | 131,116 | 0.00% |
| 753 - expressways/gateways | 126,717 | 0.00% |
| 486 - east walnut hills equivalent fund | 125,855 | 0.00% |
| 499 - Oakley equivalent fund | 123,924 | 0.00% |
| 436 - environmental studies | 122,482 | 0.00% |
| 318 - sawyer point | 115,771 | 0.00% |
| 330 - park lodge/pavilion deposits | 102,413 | 0.00% |
| 482 - downtown/otr west equivalent fund | 97,418 | 0.00% |
| 756 - water works capital | 78,225 | 0.00% |
| 485 - walnut hills equivalent fund | 77,402 | 0.00% |
| 207 - recreation stores | 76,091 | 0.00% |
| 161 - msd debt service - trustee - multi series | 71,262 | 0.00% |
| 752 - park board | 69,499 | 0.00% |
| 415 - immunization action plan | 63,781 | 0.00% |
| 478 - justice assistance grant | 56,049 | 0.00% |
| 425 - heart health in hamilton county project | 48,994 | 0.00% |
| 387 - lead hazard control research grant | 48,025 | 0.00% |
| 791 - sidewalks | 45,700 | 0.00% |
| 715 - convention facility authority | 44,830 | 0.00% |
| 454 –metropolitan medical response | 42,877 | 0.00% |
| 428 - urban forestry | 41,771 | 0.00% |
| 448 - health care services for the homeless | 41,475 | 0.00% |
| 370 - drug offender fines | 39,325 | 0.00% |
| 363 - solid waste disposal control | 38,714 | 0.00% |
| 490 - Evanston equivalent fund | 37,825 | 0.00% |
| 354 - household sewage treatment fees | 35,989 | 0.00% |
| 380 - lead poisoning control | 35,194 | 0.00% |
| 394 - state health program income | 29,632 | 0.00% |
| 413 - swimming pool license fees | 26,801 | 0.00% |
| 476 - uasi grant | 25,094 | 0.00% |
| 405 - market facilities | 24,099 | 0.00% |
| 389 - communications and marketing activities | 22,805 | 0.00% |
| other (less than 1% each) | 85,665,960 | 12.9% |
From the above table, the other category has the total expenditure of $85,665,960.
Therefore, the following table shows the amount of all 13 entities’ total expenditure by fund:
| Fund | Total expenditure |
| 050 - general fund | 168,607,659 |
| 980 - capital projects | 106,180,470 |
| 701 - metropolitan sewer district of greater Cincinnati | 83,713,741 |
| 704 - metropolitan sewer district capital improvements | 57,954,955 |
| 101 - water works | 52,292,202 |
| 711 - risk management | 32,380,425 |
| 759 - income tax – transit | 24,239,259 |
| 151 - bond retirement – city | 15,584,916 |
| 202 - fleet services | 10.994,649 |
| 898 - water works improvement 12 | 8,483,304 |
| 897 - water works improvement 11 | 8,434,379 |
| 302 - income tax – infrastructure | 7,102,773 |
| other (less than 1% each) | 85,665,960 |
| Total | 661,634,693 |
The percentage for fund is calculated as the ratio of total expenditure to the grand totals all funds.
Therefore, the following table shows the percentage of amount of all funds’ total expenditure by funds:
| Fund | Percentage of total expenditure |
| 050 - general fund | 25.5% |
| 980 - capital projects | 16.0% |
| 701 - metropolitan sewer district of greater Cincinnati | 12.7% |
| 704 - metropolitan sewer district capital improvements | 8.8% |
| 101 - water works | 7.9% |
| 711 - risk management | 4.9% |
| 759 - income tax - transit | 3.7% |
| 151 - bond retirement - city | 2.4% |
| 202 - fleet services | 1.7% |
| 898 - water works improvement 12 | 1.3% |
| 897 - water works improvement 11 | 1.3% |
| 302 - income tax - infrastructure | 1.1% |
| other (less than 1% each) | 12.9% |
| Total | 100.0% |
Software procedure:
Step-by-step software procedure to obtain bar chart for fund using Excel:
- In Excel sheet, enter Fund in one column and Percentage of total Expenditure in another column.
- Select the data, and then choose Insert > Insert Column Bar Charts.
- Select Clustered Column under More Column Charts.
Output using Excel is given below:

Interpretation:
- From the obtained table and bar chart, it can be observed that the fund category 050-General fund seems to be high, in terms of total expenditure percentage.
Want to see more full solutions like this?
Chapter 2 Solutions
Essentials of Statistics for Business and Economics (with XLSTAT Printed Access Card)


- You find out that the dietary scale you use each day is off by a factor of 2 ounces (over — at least that’s what you say!). The margin of error for your scale was plus or minus 0.5 ounces before you found this out. What’s the margin of error now?arrow_forwardSuppose that Sue and Bill each make a confidence interval out of the same data set, but Sue wants a confidence level of 80 percent compared to Bill’s 90 percent. How do their margins of error compare?arrow_forwardSuppose that you conduct a study twice, and the second time you use four times as many people as you did the first time. How does the change affect your margin of error? (Assume the other components remain constant.)arrow_forward
- Out of a sample of 200 babysitters, 70 percent are girls, and 30 percent are guys. What’s the margin of error for the percentage of female babysitters? Assume 95 percent confidence.What’s the margin of error for the percentage of male babysitters? Assume 95 percent confidence.arrow_forwardYou sample 100 fish in Pond A at the fish hatchery and find that they average 5.5 inches with a standard deviation of 1 inch. Your sample of 100 fish from Pond B has the same mean, but the standard deviation is 2 inches. How do the margins of error compare? (Assume the confidence levels are the same.)arrow_forwardA survey of 1,000 dental patients produces 450 people who floss their teeth adequately. What’s the margin of error for this result? Assume 90 percent confidence.arrow_forward
- The annual aggregate claim amount of an insurer follows a compound Poisson distribution with parameter 1,000. Individual claim amounts follow a Gamma distribution with shape parameter a = 750 and rate parameter λ = 0.25. 1. Generate 20,000 simulated aggregate claim values for the insurer, using a random number generator seed of 955.Display the first five simulated claim values in your answer script using the R function head(). 2. Plot the empirical density function of the simulated aggregate claim values from Question 1, setting the x-axis range from 2,600,000 to 3,300,000 and the y-axis range from 0 to 0.0000045. 3. Suggest a suitable distribution, including its parameters, that approximates the simulated aggregate claim values from Question 1. 4. Generate 20,000 values from your suggested distribution in Question 3 using a random number generator seed of 955. Use the R function head() to display the first five generated values in your answer script. 5. Plot the empirical density…arrow_forwardFind binomial probability if: x = 8, n = 10, p = 0.7 x= 3, n=5, p = 0.3 x = 4, n=7, p = 0.6 Quality Control: A factory produces light bulbs with a 2% defect rate. If a random sample of 20 bulbs is tested, what is the probability that exactly 2 bulbs are defective? (hint: p=2% or 0.02; x =2, n=20; use the same logic for the following problems) Marketing Campaign: A marketing company sends out 1,000 promotional emails. The probability of any email being opened is 0.15. What is the probability that exactly 150 emails will be opened? (hint: total emails or n=1000, x =150) Customer Satisfaction: A survey shows that 70% of customers are satisfied with a new product. Out of 10 randomly selected customers, what is the probability that at least 8 are satisfied? (hint: One of the keyword in this question is “at least 8”, it is not “exactly 8”, the correct formula for this should be = 1- (binom.dist(7, 10, 0.7, TRUE)). The part in the princess will give you the probability of seven and less than…arrow_forwardplease answer these questionsarrow_forward
- Selon une économiste d’une société financière, les dépenses moyennes pour « meubles et appareils de maison » ont été moins importantes pour les ménages de la région de Montréal, que celles de la région de Québec. Un échantillon aléatoire de 14 ménages pour la région de Montréal et de 16 ménages pour la région Québec est tiré et donne les données suivantes, en ce qui a trait aux dépenses pour ce secteur d’activité économique. On suppose que les données de chaque population sont distribuées selon une loi normale. Nous sommes intéressé à connaitre si les variances des populations sont égales.a) Faites le test d’hypothèse sur deux variances approprié au seuil de signification de 1 %. Inclure les informations suivantes : i. Hypothèse / Identification des populationsii. Valeur(s) critique(s) de Fiii. Règle de décisioniv. Valeur du rapport Fv. Décision et conclusion b) A partir des résultats obtenus en a), est-ce que l’hypothèse d’égalité des variances pour cette…arrow_forwardAccording to an economist from a financial company, the average expenditures on "furniture and household appliances" have been lower for households in the Montreal area than those in the Quebec region. A random sample of 14 households from the Montreal region and 16 households from the Quebec region was taken, providing the following data regarding expenditures in this economic sector. It is assumed that the data from each population are distributed normally. We are interested in knowing if the variances of the populations are equal. a) Perform the appropriate hypothesis test on two variances at a significance level of 1%. Include the following information: i. Hypothesis / Identification of populations ii. Critical F-value(s) iii. Decision rule iv. F-ratio value v. Decision and conclusion b) Based on the results obtained in a), is the hypothesis of equal variances for this socio-economic characteristic measured in these two populations upheld? c) Based on the results obtained in a),…arrow_forwardA major company in the Montreal area, offering a range of engineering services from project preparation to construction execution, and industrial project management, wants to ensure that the individuals who are responsible for project cost estimation and bid preparation demonstrate a certain uniformity in their estimates. The head of civil engineering and municipal services decided to structure an experimental plan to detect if there could be significant differences in project evaluation. Seven projects were selected, each of which had to be evaluated by each of the two estimators, with the order of the projects submitted being random. The obtained estimates are presented in the table below. a) Complete the table above by calculating: i. The differences (A-B) ii. The sum of the differences iii. The mean of the differences iv. The standard deviation of the differences b) What is the value of the t-statistic? c) What is the critical t-value for this test at a significance level of 1%?…arrow_forward
