
Videos
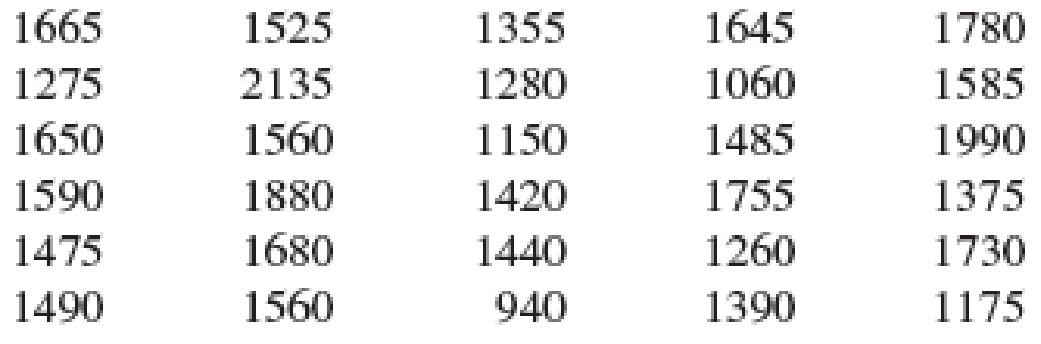
SAT Scores. The SAT is a standardized test used by many colleges and universities in their admission decisions. More than one million high school students take the SAT each year. The current version of the SAT includes three parts: reading comprehension, mathematics, and writing. A perfect combined score for all three parts is 2400. A sample of SAT scores for the combined three-part SAT are as follows:
- a. Show a frequency distribution and histogram. Begin with the first class starting at 800 and use a class width of 200.
- b. Comment on the shape of the distribution.
- c. What other observations can be made about the SAT scores based on the tabular and graphical summaries?
a.
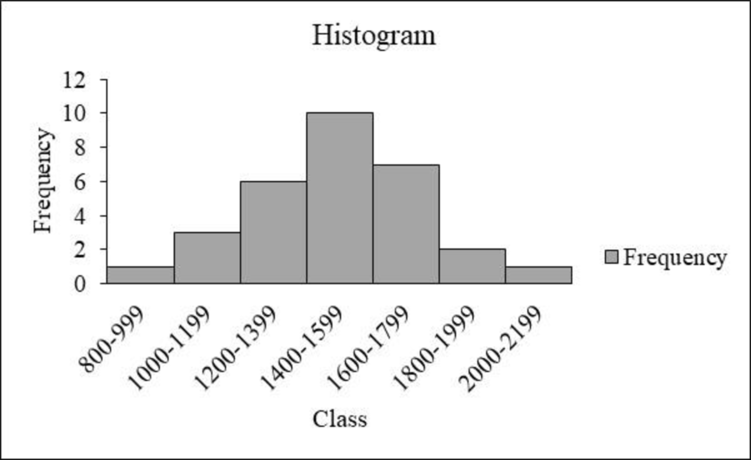
Construct the frequency distribution and histogram for the data.
Answer to Problem 44SE
The frequency distribution is tabulated below:
| Class | Tally | Frequency |
| 800-999 | 1 | |
| 1000-1199 | 3 | |
| 1200-1399 | 6 | |
| 1400-1599 | 10 | |
| 1600-1799 | 7 | |
| 1800-1999 | 2 | |
| 2000-2199 | 1 | |
| Total | 30 |
- Output using EXCEL is given below:
Explanation of Solution
Calculation:
The data represent the sample of SAT scores for the combined three part sat scores.
The frequencies are calculated using the tally mark and the method of grouping is also used because the range of the data is from 800 to 2,199. Here, the number of times each class level repeats is the frequency of that particular class.
- From the given data set, it is given that the class should be approximately started from 800 with the class width of 200.
- Make a tally mark for each value in the corresponding class and continue for all the values in the data.
- The number of tally marks in each class represents the frequency f of that class.
Similarly, the frequency of the remaining classes for the data set is given below:
| Class | Tally | Frequency |
| 800-999 | 1 | |
| 1000-1199 | 3 | |
| 1200-1399 | 6 | |
| 1400-1599 | 10 | |
| 1600-1799 | 7 | |
| 1800-1999 | 2 | |
| 2000-2199 | 1 | |
| Total | 30 |
Software procedure:
Step-by-step procedure to draw the frequency histogram chart using EXCEL software:
- In Excel sheet, enter Class in one column and Frequency in another column.
- Select the data and then choose Insert > Insert Column Bar Charts.
- Select Clustered Column Under More Column Charts.
- Double click the bars
- In Format Data Series, enter 0 in Gap Width under Series Options.
b.
Comment the shape of the distribution.
Answer to Problem 44SE
The distribution of sat score is approximately symmetric.
Explanation of Solution
Symmetric distribution:
When the left and right sides of the distribution are approximately equal or mirror images of each other, then the distribution is called as a symmetric distribution. A symmetric distribution can be U shaped or bell shaped.
From the graph, it is observed that the left and right sides of the histogram are approximately equal. In addition, the shape of the distribution is a bell-shaped curve.
Thus, it can be concluded that the distribution is approximately symmetric.
c.
Comment the observations of sat scores based on the tabular and graphical summary.
Explanation of Solution
- From the data and the histogram, it is observed that approximately 33 percent of sat score (frequency about 10 of 30) lie between 1,400 and 1,599, which is modal class of the distribution. The average value of sat scores is 1,500.
- Moreover, the scores, which are less than 800 or greater than 2,200, are unusual.
Want to see more full solutions like this?
Chapter 2 Solutions
Essentials of Statistics for Business and Economics (with XLSTAT Printed Access Card)


- 10 Meteorologists use computer models to predict when and where a hurricane will hit shore. Suppose they predict that hurricane Stat has a 20 percent chance of hitting the East Coast. a. On what info are the meteorologists basing this prediction? b. Why is this prediction harder to make than your chance of getting a head on your next coin toss? U anoiaarrow_forward6. Show that one cannot find independent, identically distributed random variables X and Y such that X-YE U(-1, 1). 7 Consider al onarrow_forward2 Which situation is more likely to produce exactly 50 percent heads: flipping a coin 10 times or flipping a coin 10,000 times?arrow_forward
- 2. Let X1, X2..... X, be independent random variables with expectation 0 and finite third moments. Show, with the aid of characteristic functions, that E(X₁ + X₂++X)³ = EX² + EX²++ EX₁₂-arrow_forward21 Check out the sales of a particular car across the United States over a 60-day period in the following figure. 800- 700- 600- Number of items sold 400 500- Line Graph of Sales 3001 16 12 18 24 30 36 42 48 54 60 60 Day a. Can you see a pattern to the sales of this car across this time period? b. What are the highest and lowest numbers of sales, and when did they occur? c. Can Can you estimate the average of all sales over this time period?arrow_forward11 Bob has glued himself to a certain slot machine for four hours in a row now with his bucket of coins and a bad attitude. He doesn't want to leave because he feels the longer he plays, the better chance he has t win eventually. Is poor Bob right?arrow_forward
- 7 You feel lucky again and buy a handful of instant lottery tickets. The last three tickets you open each win a dollar. Should you buy another ticket because you're "on a roll"?arrow_forward5 Suppose that an NBA player's free throw shooting percentage is 70 percent. a. Explain what this means as a probability. b. What's wrong with thinking that his chances of making his next free throw are 50-50 (because he either makes it or he doesn't)? 78 PART 2 Probability.arrow_forwardA couple has conceived three girls so far with a fourth baby on the way. Do you predict the newborn will be a girl or a boy? Why?arrow_forward
- 2 Suppose that you flip a coin four times, and it comes up heads each time. Does this outcome give you reason to believe that the coin isn't legitimate? dedo Raupnu stens My be sunildes ad ndaniver uoy no grin PALO STO 2010 COMO IT COUarrow_forward3 Consider tossing a fair coin 10 times and recording the number of heads that occur. a. How many possible outcomes would occur? b. What would be the probability of each of the outcomes? c. How many of the outcomes would have 1 head? What is the probability of 1 head in 10 flips? how d. How many of the outcomes would have o heads? What is the probability of o heads in 10 flips? e. What's the probability of getting 1 head or less on 10 flips of a fair coin?arrow_forward22 Bob decides that after his heart attack is a good time to get in shape, so he starts exer- cising each day and plans to increase his exercise time as he goes along. Look at the two line graphs shown in the following fig- ures. One is a good representation of his data, and the other should get as much use as Bob's treadmill before his heart attack. Exercise time 40 Line Graph 1 of Exercise Log 35 30- 25 201 20 Exercise time 80 80 60 40- 1 10 20 30 30 40 50 60 Day 170 50 80 Line Graph 2 of Exercise Log 1 10 20 90 100 30 30 40 50 60 70 80 90 100 Day a. Compare the two graphs. Do they repre- sent the same data set, or do they show totally different data sets? b. Assume that both graphs are made from the same data. Which graph is more appropriate and why?arrow_forward
 Holt Mcdougal Larson Pre-algebra: Student Edition...AlgebraISBN:9780547587776Author:HOLT MCDOUGALPublisher:HOLT MCDOUGAL
 Glencoe Algebra 1, Student Edition, 9780079039897...AlgebraISBN:9780079039897Author:CarterPublisher:McGraw Hill
 Big Ideas Math A Bridge To Success Algebra 1: Stu...AlgebraISBN:9781680331141Author:HOUGHTON MIFFLIN HARCOURTPublisher:Houghton Mifflin Harcourt
 College Algebra (MindTap Course List)AlgebraISBN:9781305652231Author:R. David Gustafson, Jeff HughesPublisher:Cengage Learning