The following data represent the responses to two question asked in a survey of 40 college students in business. What is your gender? M = male; F = female and what is your major? (A = Accounting; C = computer information Systems; M = marketing): a. Tally the data into a contingency table where the two rows represent the gender categories and three columns represent the academic major categories. b. Construct contingency tables based on percentages of all 40 student responses, based on row percentages and based on column percentages.
The following data represent the responses to two question asked in a survey of 40 college students in business. What is your gender? M = male; F = female and what is your major? (A = Accounting; C = computer information Systems; M = marketing): a. Tally the data into a contingency table where the two rows represent the gender categories and three columns represent the academic major categories. b. Construct contingency tables based on percentages of all 40 student responses, based on row percentages and based on column percentages.
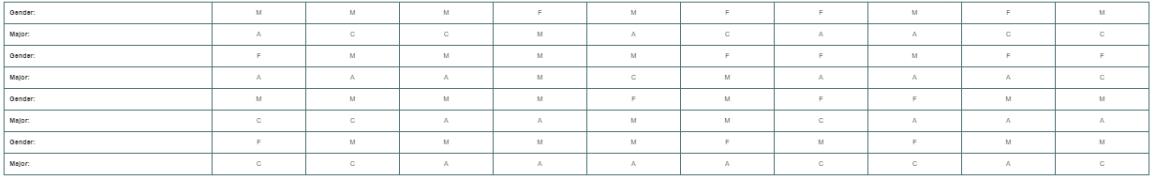
The following data represent the responses to two question asked in a survey of 40 college students in business. What is your gender?
M
=
male; F
=
female
and what is your major?
(A = Accounting; C = computer information Systems; M = marketing):
a. Tally the data into a contingency table where the two rows represent the gender categories and three columns represent the academic major categories.
b. Construct contingency tables based on percentages of all 40 student responses, based on row percentages and based on column percentages.
Definition Definition Visual representation of the relationship between two or more categorical variables. A contingency table is a categorical version of the scatterplot, which is used to visualize the linear relationship between two variables.
Examine the Variables: Carefully review and note the names of all variables in the dataset. Examples of these variables include:
Mileage (mpg)
Number of Cylinders (cyl)
Displacement (disp)
Horsepower (hp)
Research: Google to understand these variables.
Statistical Analysis: Select mpg variable, and perform the following statistical tests. Once you are done with these tests using mpg variable, repeat the same with hp
Mean
Median
First Quartile (Q1)
Second Quartile (Q2)
Third Quartile (Q3)
Fourth Quartile (Q4)
10th Percentile
70th Percentile
Skewness
Kurtosis
Document Your Results:
In RStudio: Before running each statistical test, provide a heading in the format shown at the bottom. “# Mean of mileage – Your name’s command”
In Microsoft Word: Once you've completed all tests, take a screenshot of your results in RStudio and paste it into a Microsoft Word document. Make sure that snapshots are very clear. You will need multiple snapshots. Also transfer these results to the…
Need a deep-dive on the concept behind this application? Look no further. Learn more about this topic, statistics and related others by exploring similar questions and additional content below.
Which is the best chart: Selecting among 14 types of charts Part II; Author: 365 Data Science;https://www.youtube.com/watch?v=qGaIB-bRn-A;License: Standard YouTube License, CC-BY


 Glencoe Algebra 1, Student Edition, 9780079039897...AlgebraISBN:9780079039897Author:CarterPublisher:McGraw Hill
 Big Ideas Math A Bridge To Success Algebra 1: Stu...AlgebraISBN:9781680331141Author:HOUGHTON MIFFLIN HARCOURTPublisher:Houghton Mifflin Harcourt
 Holt Mcdougal Larson Pre-algebra: Student Edition...AlgebraISBN:9780547587776Author:HOLT MCDOUGALPublisher:HOLT MCDOUGAL
 Functions and Change: A Modeling Approach to Coll...AlgebraISBN:9781337111348Author:Bruce Crauder, Benny Evans, Alan NoellPublisher:Cengage Learning