
Basic Business Statistics, Student Value Edition
14th Edition
ISBN: 9780134685113
Author: Mark L. Berenson, David M. Levine, David F. Stephan, Kathryn Szabat
Publisher: PEARSON
expand_more
expand_more
format_list_bulleted
Concept explainers
Videos
Textbook Question
Chapter 2, Problem 21PS
The financial service call centre in problem 2.20 also monitors call duration, the amount of time spent speaking to customers on the phone. The file callDuration contains the following data for time, in seconds, spent by agent talking to 50 customers:
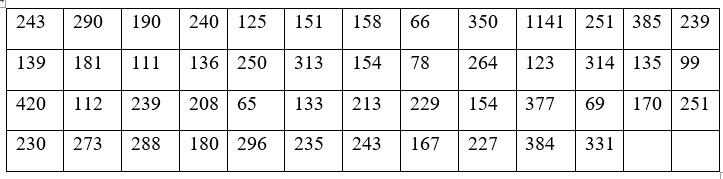
a. Construct a frequency distribution and a percentage distribution.
b. Construct a cumulative percentage distribution.
c. What can you conclude about call centre performance if a call duration target of less than 240 seconds is set?
Expert Solution & Answer
Want to see the full answer?
Check out a sample textbook solution
Students have asked these similar questions
08:34
◄ Classroom
07:59
Probs. 5-32/33
D
ا.
89
5-34. Determine the horizontal and vertical components
of reaction at the pin A and the normal force at the smooth
peg B on the member.
A
0,4 m
0.4 m
Prob. 5-34
F=600 N
fr
th
ar
0.
163586
5-37. The wooden plank resting between the buildings
deflects slightly when it supports the 50-kg boy. This
deflection causes a triangular distribution of load at its ends.
having maximum intensities of w, and wg. Determine w
and wg. each measured in N/m. when the boy is standing
3 m from one end as shown. Neglect the mass of the plank.
0.45 m
3 m
Examine the Variables: Carefully review and note the names of all variables in the dataset. Examples of these variables include:
Mileage (mpg)
Number of Cylinders (cyl)
Displacement (disp)
Horsepower (hp)
Research: Google to understand these variables.
Statistical Analysis: Select mpg variable, and perform the following statistical tests. Once you are done with these tests using mpg variable, repeat the same with hp
Mean
Median
First Quartile (Q1)
Second Quartile (Q2)
Third Quartile (Q3)
Fourth Quartile (Q4)
10th Percentile
70th Percentile
Skewness
Kurtosis
Document Your Results:
In RStudio: Before running each statistical test, provide a heading in the format shown at the bottom. “# Mean of mileage – Your name’s command”
In Microsoft Word: Once you've completed all tests, take a screenshot of your results in RStudio and paste it into a Microsoft Word document. Make sure that snapshots are very clear. You will need multiple snapshots. Also transfer these results to the…
Chapter 2 Solutions
Basic Business Statistics, Student Value Edition
Ch. 2 - A categorical variable has three categories, with...Ch. 2 - The following data represent the responses to two...Ch. 2 - The following table, stored in Smartphones Sales,...Ch. 2 - The Consumer Financial Protection Bureau reports...Ch. 2 - In addition to the impact of Big Data, what...Ch. 2 - This table represents the summer power-generating...Ch. 2 - Timetric’s 2016 survey of insurance...Ch. 2 - A survey of 1,520 Americans adults asked “Do you...Ch. 2 - A study of selected Kickstarter projects showed...Ch. 2 - Do special recommendations increase ad...
Ch. 2 - Construct an ordered array, given the following...Ch. 2 - Construct an ordered array, given the following...Ch. 2 - Planning and preparing for the unexpected,...Ch. 2 - Data was collected on salaries of compliance...Ch. 2 - The file NBACost contains the total cost ($ ) for...Ch. 2 - The file Utility contains the following data about...Ch. 2 - How much time do commuters living in or near...Ch. 2 - How do the average credit scores of people living...Ch. 2 - One operation of a mill is to cut pieces of steel...Ch. 2 - Call centers today play an important role in...Ch. 2 - The financial service call centre in problem 2.20...Ch. 2 - The file Bulbs contains the life (in hours) of a...Ch. 2 - The file Drink Contains the following data for the...Ch. 2 - A survey of online shoppers revealed that in 2015...Ch. 2 - How do college students spend their day? The 2016...Ch. 2 - The Energy Information Administration reported the...Ch. 2 - The Consumer Financial Protection Bureau reports...Ch. 2 - The following table indicates the percentage of...Ch. 2 - Timetric’s 2016 survey of insurance...Ch. 2 - A survey of 1,520 American adults asked “Do you...Ch. 2 - A study of selected Kickstarter projects showed...Ch. 2 - Do special recommendations increase ad...Ch. 2 - Construct a stern-and-leaf display, given the...Ch. 2 - Construct an ordered array, given the following...Ch. 2 - The following is a stern-and0-leaf display...Ch. 2 - The file NBACost contains the total cost in$ for...Ch. 2 - The file MobileSpeed contains the overall download...Ch. 2 - The file Utility contains the following data about...Ch. 2 - As player salaries have increases, the cost of...Ch. 2 - The following histogram and cumulative percentage...Ch. 2 - How much time do Americans living in cities spend...Ch. 2 - How do the average credit scores of people living...Ch. 2 - One operation of a mill is to cut pieces of steel...Ch. 2 - Call centers today play an important role in...Ch. 2 - The financial service call center in problem 2.44...Ch. 2 - The file Bulbs contains the life (in hours) of a...Ch. 2 - The data stored in Drink represents the amount of...Ch. 2 - The following is a set of data from a sample of...Ch. 2 - The following is a series of annual sales...Ch. 2 - Movie companies need to predict the gross receipts...Ch. 2 - Data were collected on the typical cost of dining...Ch. 2 - The file Mobile contains the overall download and...Ch. 2 - A Pew Research Center survey found a noticeable...Ch. 2 - How have stocks performed in the past? The...Ch. 2 - The file NewHomeSales contains the number of new...Ch. 2 - The file Movie Attendance 16 contains the yearly...Ch. 2 - The Super Bowl is a big viewing event watched by...Ch. 2 - Using the sample of retirement funds stored in...Ch. 2 - Using the sample of retirement funds stored in...Ch. 2 - Prob. 60PSCh. 2 - Using the sample of retirement funds stored in...Ch. 2 - Prob. 62PSCh. 2 - Using the sample of retirement funds stored in...Ch. 2 - Prob. 64PSCh. 2 - Using the sample of retirement funds stored in...Ch. 2 - Prob. 66PSCh. 2 - Prob. 67PSCh. 2 - Prob. 68PSCh. 2 - Prob. 71PSCh. 2 - Prob. 72PSCh. 2 - Examine the following visualization, adapted from...Ch. 2 - Prob. 75PSCh. 2 - Prob. 76PSCh. 2 - How do histograms and polygons differ in...Ch. 2 - Why would you construct a summary table?Ch. 2 - What are the advantages and disadvantage of using...Ch. 2 - Compare and contrast the bar chart for categorical...Ch. 2 - What is the difference between a time-series plot...Ch. 2 - Why is it said that the main feature of a Pareto...Ch. 2 - What are the three different ways to break down...Ch. 2 - How can a multidimensional table differ from a...Ch. 2 - What type of insights can you gain from a...Ch. 2 - Prob. 86PSCh. 2 - What is the difference between a time-series plot...Ch. 2 - The following table shown in the TextbookCosts...Ch. 2 - The following table represents the market share...Ch. 2 - B2B marketers in North America were surveyed about...Ch. 2 - The owner of a restaurant that services...Ch. 2 - Suppose that the owner of the restaurant in...Ch. 2 - The following data represents the pounds per...Ch. 2 - The Air Travel Consumer Report, a monthly product...Ch. 2 - One of the major measures of the quality of...Ch. 2 - The file DomesticBeer Contains the percentage...Ch. 2 - Prob. 97PSCh. 2 - The file CDRate contains the yields for one-year...Ch. 2 - The file CEO 2016 includes the total compensation...Ch. 2 - Prob. 100PSCh. 2 - What was the average price of a room at two-star,...Ch. 2 - The file Protein contains calorie and cholesterol...Ch. 2 - The file Natural Gas contains the U.S. monthly...Ch. 2 - The data stored in Drink represent the amount of...Ch. 2 - Prob. 105PSCh. 2 - A/B testing allows business to test a new design...Ch. 2 - Referring to the results from Problem 2.100 on...
Knowledge Booster


Learn more about
Need a deep-dive on the concept behind this application? Look no further. Learn more about this topic, statistics and related others by exploring similar questions and additional content below.Similar questions
- Examine the Variables: Carefully review and note the names of all variables in the dataset. Examples of these variables include: Mileage (mpg) Number of Cylinders (cyl) Displacement (disp) Horsepower (hp) Research: Google to understand these variables. Statistical Analysis: Select mpg variable, and perform the following statistical tests. Once you are done with these tests using mpg variable, repeat the same with hp Mean Median First Quartile (Q1) Second Quartile (Q2) Third Quartile (Q3) Fourth Quartile (Q4) 10th Percentile 70th Percentile Skewness Kurtosis Document Your Results: In RStudio: Before running each statistical test, provide a heading in the format shown at the bottom. “# Mean of mileage – Your name’s command” In Microsoft Word: Once you've completed all tests, take a screenshot of your results in RStudio and paste it into a Microsoft Word document. Make sure that snapshots are very clear. You will need multiple snapshots. Also transfer these results to the…arrow_forward2 (VaR and ES) Suppose X1 are independent. Prove that ~ Unif[-0.5, 0.5] and X2 VaRa (X1X2) < VaRa(X1) + VaRa (X2). ~ Unif[-0.5, 0.5]arrow_forward8 (Correlation and Diversification) Assume we have two stocks, A and B, show that a particular combination of the two stocks produce a risk-free portfolio when the correlation between the return of A and B is -1.arrow_forward
- 9 (Portfolio allocation) Suppose R₁ and R2 are returns of 2 assets and with expected return and variance respectively r₁ and 72 and variance-covariance σ2, 0%½ and σ12. Find −∞ ≤ w ≤ ∞ such that the portfolio wR₁ + (1 - w) R₂ has the smallest risk.arrow_forward7 (Multivariate random variable) Suppose X, €1, €2, €3 are IID N(0, 1) and Y2 Y₁ = 0.2 0.8X + €1, Y₂ = 0.3 +0.7X+ €2, Y3 = 0.2 + 0.9X + €3. = (In models like this, X is called the common factors of Y₁, Y₂, Y3.) Y = (Y1, Y2, Y3). (a) Find E(Y) and cov(Y). (b) What can you observe from cov(Y). Writearrow_forward1 (VaR and ES) Suppose X ~ f(x) with 1+x, if 0> x > −1 f(x) = 1−x if 1 x > 0 Find VaRo.05 (X) and ES0.05 (X).arrow_forward
- Joy is making Christmas gifts. She has 6 1/12 feet of yarn and will need 4 1/4 to complete our project. How much yarn will she have left over compute this solution in two different ways arrow_forwardSolve for X. Explain each step. 2^2x • 2^-4=8arrow_forwardOne hundred people were surveyed, and one question pertained to their educational background. The results of this question and their genders are given in the following table. Female (F) Male (F′) Total College degree (D) 30 20 50 No college degree (D′) 30 20 50 Total 60 40 100 If a person is selected at random from those surveyed, find the probability of each of the following events.1. The person is female or has a college degree. Answer: equation editor Equation Editor 2. The person is male or does not have a college degree. Answer: equation editor Equation Editor 3. The person is female or does not have a college degree.arrow_forward
arrow_back_ios
SEE MORE QUESTIONS
arrow_forward_ios
Recommended textbooks for you
 Glencoe Algebra 1, Student Edition, 9780079039897...AlgebraISBN:9780079039897Author:CarterPublisher:McGraw Hill
Glencoe Algebra 1, Student Edition, 9780079039897...
Algebra
ISBN:9780079039897
Author:Carter
Publisher:McGraw Hill
The Shape of Data: Distributions: Crash Course Statistics #7; Author: CrashCourse;https://www.youtube.com/watch?v=bPFNxD3Yg6U;License: Standard YouTube License, CC-BY
Shape, Center, and Spread - Module 20.2 (Part 1); Author: Mrmathblog;https://www.youtube.com/watch?v=COaid7O_Gag;License: Standard YouTube License, CC-BY
Shape, Center and Spread; Author: Emily Murdock;https://www.youtube.com/watch?v=_YyW0DSCzpM;License: Standard Youtube License