Videos
To graph: The
Explanation of Solution
Given information:
The quadratic equation
Graph:
The graph of the quadratic equation
Consider the quadratic equation,
Now put the values of
The method of middle term factorisation is used in the equation
Now either
So
Here observed the equation of parabola, the coefficient of
The roots and the shape of parabola is cleared.
The graph of the function
Substitute
Substitute
Substitute
Observe that as the value of
Steps to plot the graph of the equation
Step 1: Press
Step 2: Use the down arrow key to reach
Step 3: Press
Step 4: Press
Step 5: Enter the function
Step 6: Press
For better view of graph.
Step 8: Press
The result obtained on the screen is provided below,
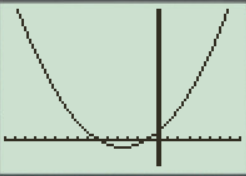
Interpretation:
The equation of the function
The parabola opens upward.
The
Therefore, in the equation,
Therefore, the equation
a.
When the
Steps to plot the graph of the equation
Step 1: Press
Step 2: Use the down arrow key to reach
Step 3: Press
Step 4: Press
Step 5: Enter the function
Step 6: Press
For better view of graph.
Step 8: Press
The result obtained on the screen is provided below,
This window is not perfect viewing window.
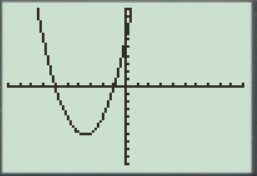
b.
When the
Steps to plot the graph of the equation
Step 1: Press
Step 2: Use the down arrow key to reach
Step 3: Press
Step 4: Press
Step 5: Enter the function
Step 6: Press
For better view of graph.
Step 8: Press
The result obtained on the screen is provided below,
This window is not a perfect viewing window.
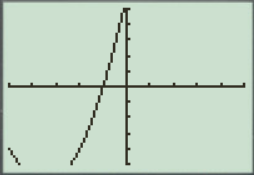
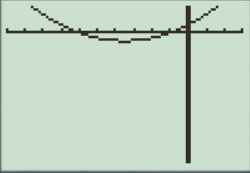
c.
When the
Steps to plot the graph of the equation with the help of graphing utility are as follows:
Step 1: Press
Step 2: Use the down arrow key to reach
Step 3: Press
Step 4: Press
Step 5: Enter the function
Step 6: Press
For better view of graph.
Step 8: Press
The result obtained on the screen is provided below,
This is the perfect viewing window.
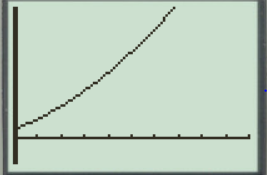
d.
When the
Steps to plot the graph of the equation
Step 1: Press
Step 2: Use the down arrow key to reach
Step 3: Press
Step 4: Press
Step 5: Enter the function
Step 6: Press
For better view of graph.
Step 8: Press
The result obtained on the screen is provided below,
This window has large view, in this the graph points are not clear.
So perfect viewing window of the graph
Thus, option ‘c’
Chapter 1 Solutions
Precalculus - A Custom Text for UNLV


- 8. For x>_1, the continuous function g is decreasing and positive. A portion of the graph of g is shown above. For n>_1, the nth term of the series summation from n=1 to infinity a_n is defined by a_n=g(n). If intergral 1 to infinity g(x)dx converges to 8, which of the following could be true? A) summation n=1 to infinity a_n = 6. B) summation n=1 to infinity a_n =8. C) summation n=1 to infinity a_n = 10. D) summation n=1 to infinity a_n diverges.arrow_forwardPLEASE SHOW ME THE RIGHT ANSWER/SOLUTION SHOW ME ALL THE NEDDED STEP 13: If the perimeter of a square is shrinking at a rate of 8 inches per second, find the rate at which its area is changing when its area is 25 square inches.arrow_forwardDO NOT GIVE THE WRONG ANSWER SHOW ME ALL THE NEEDED STEPS 11: A rectangle has a base that is growing at a rate of 3 inches per second and a height that is shrinking at a rate of one inch per second. When the base is 12 inches and the height is 5 inches, at what rate is the area of the rectangle changing?arrow_forward
- please answer by showing all the dfalowing necessary step DO NOT GIVE ME THE WRONG ANSWER The sides of a cube of ice are melting at a rate of 1 inch per hour. When its volume is 64 cubic inches, at what rate is its volume changing?arrow_forwardSox & Sin (px) dx 0arrow_forward8 L 8 e ipx dxarrow_forward
- Find the Taylor polynomial T³(×) for the function f centered at the number a. f(x) = xe-2x a = 0 T3(x) =arrow_forwardFor each graph in Figure 16, determine whether f (1) is larger or smaller than the slope of the secant line between x = 1 and x = 1 + h for h > 0. Explain your reasoningarrow_forwardPoints z1 and z2 are shown on the graph.z1 is at (4 real,6 imaginary), z2 is at (-5 real, 2 imaginary)Part A: Identify the points in standard form and find the distance between them.Part B: Give the complex conjugate of z2 and explain how to find it geometrically.Part C: Find z2 − z1 geometrically and explain your steps.arrow_forward
- A polar curve is represented by the equation r1 = 7 + 4cos θ.Part A: What type of limaçon is this curve? Justify your answer using the constants in the equation.Part B: Is the curve symmetrical to the polar axis or the line θ = pi/2 Justify your answer algebraically.Part C: What are the two main differences between the graphs of r1 = 7 + 4cos θ and r2 = 4 + 4cos θ?arrow_forwardA curve, described by x2 + y2 + 8x = 0, has a point A at (−4, 4) on the curve.Part A: What are the polar coordinates of A? Give an exact answer.Part B: What is the polar form of the equation? What type of polar curve is this?Part C: What is the directed distance when Ø = 5pi/6 Give an exact answer.arrow_forwardNew folder 10. Find the area enclosed by the loop of the curve (1- t², t-t³)arrow_forward
 Calculus: Early TranscendentalsCalculusISBN:9781285741550Author:James StewartPublisher:Cengage Learning
 Thomas' Calculus (14th Edition)CalculusISBN:9780134438986Author:Joel R. Hass, Christopher E. Heil, Maurice D. WeirPublisher:PEARSON
 Calculus: Early Transcendentals (3rd Edition)CalculusISBN:9780134763644Author:William L. Briggs, Lyle Cochran, Bernard Gillett, Eric SchulzPublisher:PEARSON
 Calculus: Early TranscendentalsCalculusISBN:9781319050740Author:Jon Rogawski, Colin Adams, Robert FranzosaPublisher:W. H. Freeman
 Calculus: Early Transcendental FunctionsCalculusISBN:9781337552516Author:Ron Larson, Bruce H. EdwardsPublisher:Cengage Learning