Principles of Instrumental Analysis
7th Edition
ISBN: 9781305577213
Author: Douglas A. Skoog, F. James Holler, Stanley R. Crouch
Publisher: Cengage Learning
expand_more
expand_more
format_list_bulleted
Concept explainers
Textbook Question
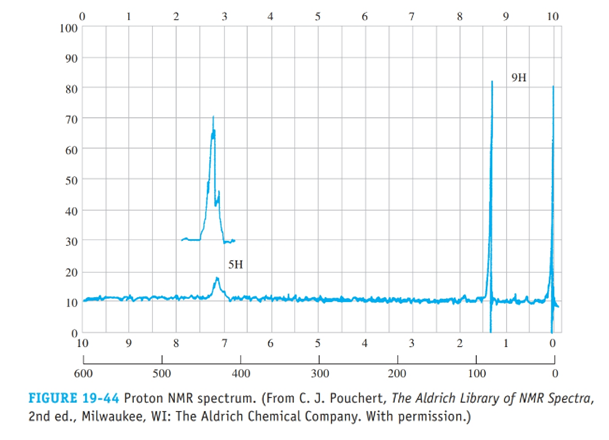
Chapter 19, Problem 19.36QAP
From the proton NMR spectrum in Figure 19-44, deduce the structure of this hydrocarbon
Expert Solution & Answer
Trending nowThis is a popular solution!
Students have asked these similar questions
The functional groups in an organic compound can frequently be deduced from its infrared absorption spectrum. A compound containing no nitrogen exhibits strong,
broad absorption across the 2500-3300 cm³¹ region, accompanied by 2200 (w) and 1715 (s) cm-¹ bands.
Relative absorption intensity: (s)=strong, (m)=medium, (w)=weak.
What functional class(es) does the compound belong to?
List only classes for which evidence is given here. Attach no significance to evidence not cited explicitly.
Do not over-interpret exact absorption band positions. None of your inferences should depend on small differences like 10 to 20 cm³¹.
The functional class(es) of this compound is(are)
. (Enter letters from the table below, in any order, with no spaces or commas.)
a. alkane (List only if no other functional class applies.)
b. alkene
c. terminal alkyne
d. internal alkyne
e. arene
f. alcohol
g. ether
h. amine
i. aldehyde or ketone
j.carboxylic acid
k. ester
I. nitrile
How can you distinguish aldehydes, ketones, and carboxylic acids from each other using IR spectra? Explain using specific examples.
In Section 6.2d, we saw that the pK, of an acid is
equal to the pH of the solution at which half the acid
has dissociated into its conjugate base. UV-vis
spectroscopy can be used to measure the relative
concentrations involved if the acid or conjugate base
absorbs UV-vis light. With this in mind, suppose that
a particular acid has a Amax of 312 nm. The figure
here shows the absorbance at that wavelength as
a function of pH. What is the pk, of the acid?
3
4
6
7
8
10
11
12
pH
Absorbance at 312 nm
Chapter 19 Solutions
Principles of Instrumental Analysis
Ch. 19 - Prob. 19.1QAPCh. 19 - Prob. 19.2QAPCh. 19 - Prob. 19.3QAPCh. 19 - Prob. 19.4QAPCh. 19 - Prob. 19.5QAPCh. 19 - A nucleus has a spin quantum number of 7/2. How...Ch. 19 - Prob. 19.7QAPCh. 19 - Prob. 19.8QAPCh. 19 - Prob. 19.9QAPCh. 19 - Why is 133C-133C spin-spin splitting not observed...
Ch. 19 - Prob. 19.11QAPCh. 19 - Prob. 19.12QAPCh. 19 - Prob. 19.13QAPCh. 19 - What is a rotating frame of reference?Ch. 19 - How will E for an isolated 13C nucleus compare...Ch. 19 - Prob. 19.16QAPCh. 19 - Prob. 19.17QAPCh. 19 - Prob. 19.18QAPCh. 19 - Prob. 19.19QAPCh. 19 - Prob. 19.20QAPCh. 19 - Prob. 19.21QAPCh. 19 - Prob. 19.22QAPCh. 19 - Prob. 19.23QAPCh. 19 - Prob. 19.24QAPCh. 19 - Prob. 19.25QAPCh. 19 - Prob. 19.26QAPCh. 19 - Prob. 19.27QAPCh. 19 - Prob. 19.28QAPCh. 19 - Prob. 19.29QAPCh. 19 - Prob. 19.30QAPCh. 19 - The proton NMR spectrum in Figure 19.39 is for an...Ch. 19 - The proton NMR spectrum in Figure 19-40 is for a...Ch. 19 - Prob. 19.33QAPCh. 19 - Prob. 19.34QAPCh. 19 - Prob. 19.35QAPCh. 19 - From the proton NMR spectrum in Figure 19-44,...Ch. 19 - From the proton spectrum given in Figure 19-45,...Ch. 19 - Prob. 19.38QAPCh. 19 - Prob. 19.39QAPCh. 19 - Prob. 19.40QAPCh. 19 - Prob. 19.41QAPCh. 19 - Prob. 19.42QAP
Knowledge Booster
Learn more about
Need a deep-dive on the concept behind this application? Look no further. Learn more about this topic, chemistry and related others by exploring similar questions and additional content below.Similar questions
- A student has acquired an IR spectra of an unknown six-carbon molecule and has determined that it is either 2-hexyne, 1- hexyne, or 1-hexene. How can the student use their knowledge of IR spectroscopy to determine the identity of the molecule? In your answer, clearly specify what regions of the IR spectrum the student should look at and what bonds are responsible for the absorption bands you indicate.arrow_forwardThe functional groups in an organic compound can frequently be deduced from its infrared absorption spectrum. A compound containing C, H, and O exhibits broad absorption at 3450 cm-1 (m) and an intense band at 1725, plus a band at 1100 cm-1 (m).Relative absorption intensity: (s)=strong, (m)=medium, (w)=weak. What functional class(es) does the compound belong to? List only classes for which evidence is given here. Attach no significance to evidence not cited explicitly.Do not over-interpret exact absorption band positions. None of your inferences should depend on small differences like 10 to 20 cm-1. The functional class(es) of this compound is(are)fill in the blank 1.(Enter letters from the table below, in any order, with no spaces or commas.) a. alkane (List only if no other functional class applies.) b. alkene h. amine c. terminal alkyne i. aldehyde or ketone d. internal alkyne j. carboxylic acid e. arene k. ester f. alcohol l. nitrile g. etherarrow_forwardConsider the following Proton and Carbon NMR spectra for the same compound, and it contains Chlorine. Decide on a structure which is consistent with the spectral data, and 'assign" both spectra as best as you can. "Assign" = draw structure, label (a,b,c etc) and indicate which peaks belong to which type.arrow_forward
- Carbon monoxide [CO] exhibits an IR absorption at 2143cm-1, acetone [CH3C(O)CH3],exhibits an IR absorption for the CO vibration at 1715 cm-1 and ethanol [CH3CH2OH] exhibits an IR absorption for CO at ~1150 cm-1. Draw Lewis structures of these three molecules and use your structures to explain the observed differences in the CO IR absorption peak frequency (nCO).arrow_forward1- While cleaning out a laboratory shelf, you have made a mistake in labeling two bottles of ethanol and acetic acid. To identify the molecular structure of the contents of the bottle, samples were submitted for analysis using infrared spectroscopy, based on the IR results, draw the molecular structure of the molecule that would correspond to the spectrum for that compound. Justify your answer Spectrum A Spectrum B 0. 04 0.2 3000 2000 Waverumber icm-1) 1000 Transmitancearrow_forwardConsider the aromatic compound 4-isopropyl-benzonitrile. (Benzonitrile is a benzene ring with the nitrile group on position 1.) How many signals for non-equivalent types of protons will be in its proton NMR spectrum?arrow_forward
- Analyse the high resolution proton NMR spectrum and suggest a compund and write its name. Also write down which parts of the molecule belongs to each peak.arrow_forwardOrganic Chemistry: IR spectroscopy A student obtains an IR spectrum with an intense, broad absorption at about 3350 cm-1. The student claims that the sample is an alcohol, but the professor says that the absorption is there because the sample is contaminated with water. What peak(s) could be looked for to show that the sample is indeed an alcohol? Which functional groups would make it difficult to use this strategy?arrow_forwardThe functional groups in an organic compound can frequently be deduced from its infrared absorption spectrum. A hydrocarbon exhibits no bands above 3000 but gives weak absorption at 2200 cm-1.Relative absorption intensity: (s)=strong, (m)=medium, (w)=weak. What functional class(es) does the compound belong to? List only classes for which evidence is given here. Attach no significance to evidence not cited explicitly.Do not over-interpret exact absorption band positions. None of your inferences should depend on small differences like 10 to 20 cm-1. The functional class(es) of this compound is(are)fill in the blank 1.(Enter letters from the table below, in any order, with no spaces or commas.) a. alkane (List only if no other functional class applies.) b. alkene h. amine c. terminal alkyne i. aldehyde or ketone d. internal alkyne j. carboxylic acid e. arene k. ester f. alcohol l. nitrile g. etherarrow_forward
- 4a. Questions (i) and (ii) are based on the following IR spectra. Identify TWO (2)functional groups presence in the molecule and state their frequencies. Predict the possible chemical structure of molecule based on the IR spectra with chemical formula C7H8.arrow_forwardThe functional groups in an organic compound can frequently be deduced from its infrared absorption spectrum. A compound contains no nitrogen and exhibits absorption bands at 3300 (s) and 2150 (m) cm ¹¹. Relative absorption intensity: (s)=strong, (m)=medium, (w)=weak. What functional class(es) does the compound belong to? List only classes for which evidence is given here. Attach no significance to evidence not cited explicitly. Do not over-interpret exact absorption band positions. None of your inferences should depend on small differences like 10 to 20 cm³¹. The functional class(es) of this compound is(are) . (Enter letters from the table below, in any order, with no spaces or commas.) a. alkane (List only if no other functional class applies.) b. alkene c. terminal alkyne d. internal alkyne e. arene f. alcohol g. ether Submit Answer h. amine i. aldehyde or ketone j. carboxylic acid k. ester I. nitrile Retry Entire Group 9 more group attempts remainingarrow_forwardWhat is the structure of the unknown? Determine it by analyzing the spectroscopic data given in IR, MS, 1H NMR, 13C NMR (Broadband decoupled with carbon types) and fully substantiate your answer with key supporting data from each spectrum.arrow_forward
arrow_back_ios
SEE MORE QUESTIONS
arrow_forward_ios
Recommended textbooks for you
- Principles of Instrumental AnalysisChemistryISBN:9781305577213Author:Douglas A. Skoog, F. James Holler, Stanley R. CrouchPublisher:Cengage Learning
Principles of Instrumental Analysis
Chemistry
ISBN:9781305577213
Author:Douglas A. Skoog, F. James Holler, Stanley R. Crouch
Publisher:Cengage Learning
IR Spectroscopy; Author: Professor Dave Explains;https://www.youtube.com/watch?v=_TmevMf-Zgs;License: Standard YouTube License, CC-BY