
Concept explainers
a)
To determine: System utilization rate.
Introduction: Poisson distribution is utilized to ascertain the probability of an occasion happening over a specific time period or interval. The interval can be one of time, zone, volume or separation. The probability of an event happening is discovered utilizing the equation in the Poisson distribution.
a)
Answer to Problem 17P
Explanation of Solution
Given Information:
It is given that the processing time is 4 customers per hour and there are 5 servers to process the customers.
| Class | Arrivals per Hour |
| 1 | 2 |
| 2 | 4 |
| 3 | 3 |
| 4 | 2 |
Calculate the system utilization:
It is calculated by adding all the total customer hours for each class and the result is divided with number of servers and customer process per hour.
Here,
M = number of servers
Hence the system utilization is 0.5500.
b)
To determine: The average customer waiting for service for each class and waiting in each class on average.
b)
Answer to Problem 17P
Explanation of Solution
Given Information:
| Class | Arrivals per Hour |
| 1 | 2 |
| 2 | 4 |
| 3 | 3 |
| 4 | 2 |
It is given that the processing time is 4 customers per hour and there are 5 servers to process the customers.
Calculate the average number of customers
It is calculated by dividing the total customers arrive per hour with customer process per hour.
Here,
r = average number of customers
Calculate average number of customers waiting for service (Lq) using infinite-source table values for
The Lq values for
Calculate A using Formula 18-16 from book:
It is calculated by subtracting 1 minus system utilization rate and multiplying the result with Lq, the whole result is divided by total customer arrival rate.
Here,
Lq = average number of customers waiting for service
Calculate B using Formula 18-17 from book for each category:
It is calculated by multiplying number of servers with customer service process rate per hour and the result is divided by total customer arrival rate for each category.
Here,
M = number of servers
Calculate the average waiting time for class 1 and class 2
It is calculated by multiplying A with B0 and B1, the result is divided by 1.
Calculate the average number of customers that are waiting for service for class 1 and class 2
It is calculated by multiplying total customer arrival rate with average waiting time for units in each category.
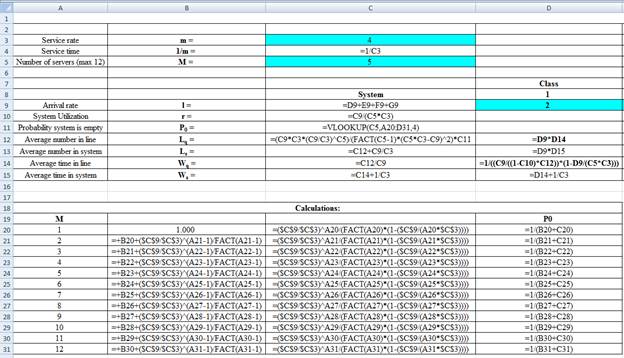
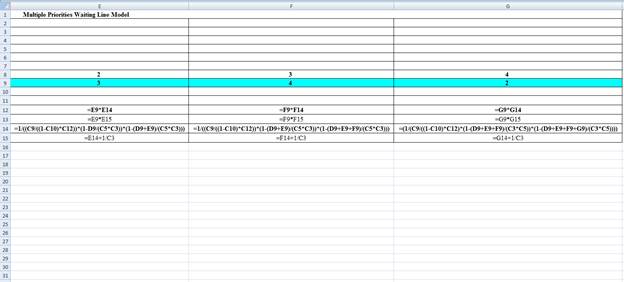
Excel Spreadsheet:
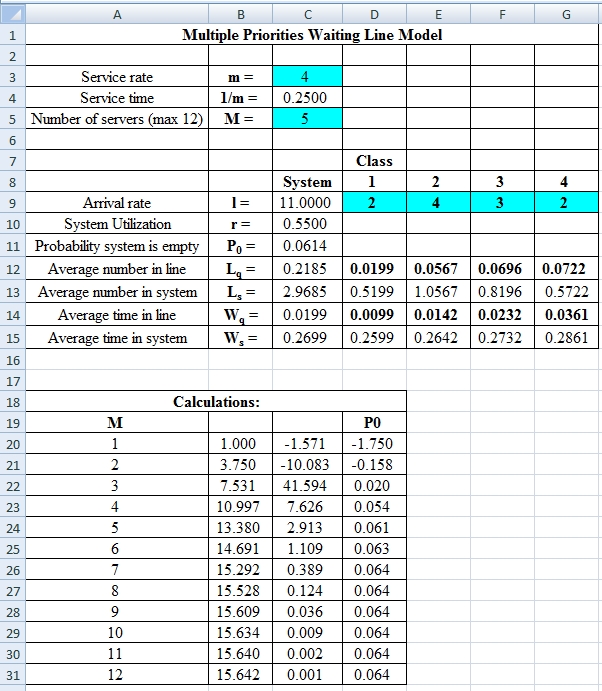
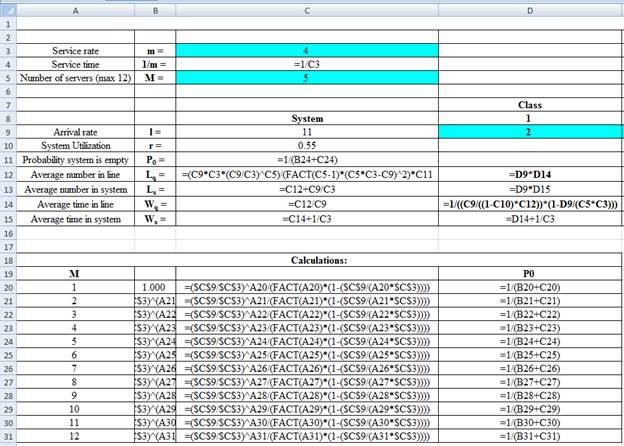
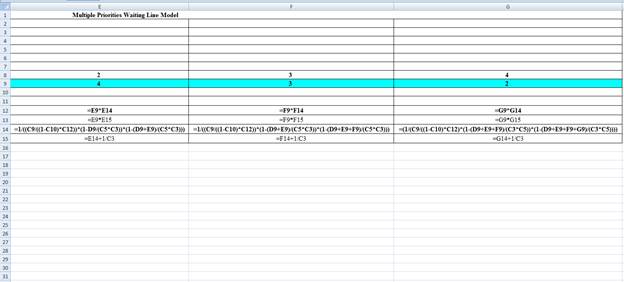
Excel Workings:
Hence the average wait time for service by customers for class 1 is 0.0099 hours, class 2 is 0.0142 hours, class 3 is 0.0232 hours and class 4 is 0.0361 hours. The waiting in each class on average for class 1 is 0.0199 customers, class 2 is 0.0567 customers, class 3 is 0.0696 customers and class 4 is 0.0722 customers.
c)
To determine: The average customer waiting for service for each class and waiting in each class on average.
c)
Answer to Problem 17P
Explanation of Solution
Given Information:
It is given that the processing time is 4 customers per hour and there are 5 servers to process the customers. The second priority class is reduced to 3 units per hour by shifting some into the third party class. The arrival rate is as follows,
| Class | Arrivals per Hour |
| 1 | 2 |
| 2 | 3 |
| 3 | 4 |
| 4 | 2 |
Calculate the average number of customers
It is calculated by dividing the total customers arrive per hour with customer process per hour.
Here,
r = average number of customers
Calculate average number of customers waiting for service (Lq) using infinite-source table values for
The Lq values for
Calculate A using Formula 18-16 from book
It is calculated by subtracting 1 minus system utilization rate and multiplying the result with Lq, the whole result is divided by total customer arrival rate.
Here,
Lq = average number of customers waiting for service
Calculate B using Formula 18-17 from book for each category
It is calculated by multiplying number of servers with customer service process rate per hour and the result is divided by total customer arrival rate for each category.
Here,
M = number of servers
Calculate the average waiting time for class 1 and class 2
It is calculated by multiplying A with B0 and B1, the result is divided by 1.
Calculate the average number of customers that are waiting for service for class 1 and class 2
It is calculated by multiplying total customer arrival rate with average waiting time for units in each category.
Excel Spreadsheet:
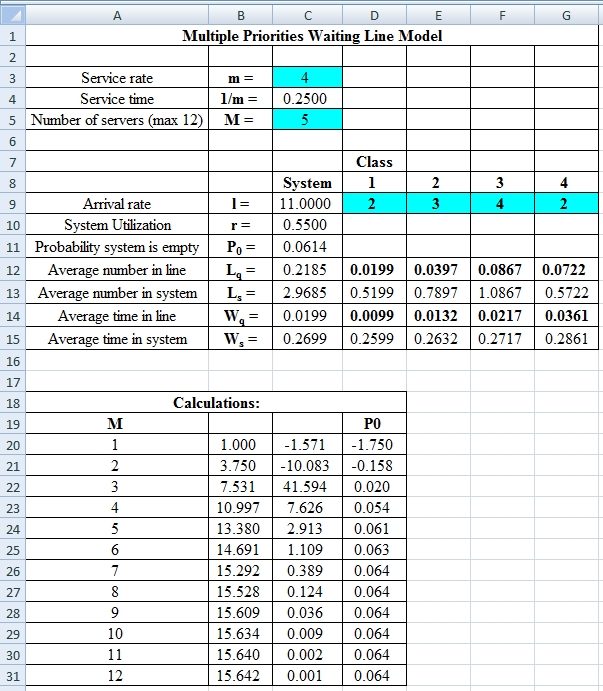
Excel Workings:
Hence the average wait time for service by customers for class 1 is 0.0099 hours, class 2 is 0.0132 hours, class 3 is 0.0217 hours and class 4 is 0.0361 hours. The waiting in each class on average for class 1 is 0.0199 customers, class 2 is 0.0397 customers, class 3 is 0.0867 customers and class 4 is 0.0722 customers.
d)
To determine: The observations based on the results from part c.
d)
Answer to Problem 17P
Explanation of Solution
Calculate the change in average wait time for each class.
It is calculated by subtracting the final answer for average wait time for service by customers from part b with the final answer for average wait time for service by customers from part c.
The above results suggest that there is a decrease in average wait time for class 2 and class 3. Class 1 and 4 remains constant.
Calculate the change in average number waiting for each class.
It is calculated by subtracting the final answer for waiting on average from part b with the final answer for waiting on average from part c.
The above results suggest that there is a decrease in average waiting for class 2 and an increase in class 3. Class 1 and 4 remains constant.
Want to see more full solutions like this?
Chapter 18 Solutions
Operations Management


- Respond to Adam; Agree or disagree The Trust Scale is perhaps the most famous tool for measuring trust, which was made by Mayer, Davis, and Schoorman (1995). It is based on the person's ability (competence), benevolence (intentions), and integrity (following principles). This tool is an assessment of other people's perceptions about their tests (competence), their beliefs (intentions), and their rules (integrity). A Likert-type scale questionnaire uses it; participants express their opinions on the above, and then data are summed in order to find out the general level of trust in the relationship. In organizational settings, where it is broadly used for measuring employee trust in leadership or peers, it also gives useful insights into workplace dynamics as well as potential barriers to collaboration (Mayer, Davis, & Schoorman, 1995). This tool is likely to render a true measurement of trust, especially in situations that are clearly structured so that trust behaviors are visible…arrow_forwardRespond to Lisa; Agree or disagree Trust is an essential trait required for relationships to thrive among individuals and even organizations. Employees are also expected to be trustworthy as a core value for building a robust and reliable corporate culture. Even though trust is a vital ingredient for human relationship and helps to understand organizational behaviors and interpersonal relationships, it is challenging measure the trust and its level (Evans & Revelle, 2008). However, several tools have been developed in an attempt to quantify trust but there is no known effectiveness in assessing its level based on interpersonal traits. Many studies have been conducted seeking to know how trust can be measured although they treated trust as situational construct. Some of the tools used include psychometric properties of a new trust inventory known as PTS (Propensity to Trust Survey) and Trust Style Inventory (TSI). PTS mostly relied on online survey data but has been increasingly…arrow_forward◄ Mail 18:09 5G CSTUDY_Jan25_BCOMHO...al_20241129091837.pdf.pdf FORMATIVE ASSESSMENT 1 Read the case study below and answer ALL of the questions that follow. Title: Upskilling and reskilling priorities for the gen Al era [100 MARKS] To realize the opportunity of generative Al, organizations should take a cross-collaborative, scaled approach to upskilling and reskilling workforces. The proliferation of generative artificial intelligence (gen Al) innovations necessitates a new approach to employee attraction, engagement, and retention. Our survey finds that compared to late adopters, companies adopting gen Al earlier place greater emphasis on talent development, with two-thirds already having a strategic approach to address their future talent and skill requirements. Organizations should think about a breadth of gen Al capability needs-from broad fluency supporting business goals, to deep technical and domain-specific capabilities-as well as the speed and scale at which they should be…arrow_forward
- Question 1 (25 Marks) Procurement is a key strategic function that directly impacts an organisation’s ability to create value, manage risks, and maintain a competitive advantage in the market. Critically analyse the strategic roles of procurement and how procurement practices in the fashion industry can strategically address complex challenges such as supply chain efficiency, sustainability, cost management, and global sourcing. Provide examples from the fashion industry to further your analysis. Question 2 (25 Marks) There are several enablers that need to be in place for a procurement and supply management function to implement a value-generating mode. Examine the extent of these enablers as they present themselves in the fashion industry. Question 3 (25 Marks) You are hired by local clothing chain Fashion World. The brand wants to instill a culture of professional purchasing. Construct a policy document which you would present at the next strategy meeting which inculcates the…arrow_forward◄ Files 18:11 5G CSTUDY_Jan25_SCMH_PS...Final_20241203151014.pdf FORMATIVE ASSESSMENT 1 Read the article below and answer ALL questions that follow Are your favourite fashion brands using forced labour? [100 MARKS] The global fashion and retail industry's reliance on producing quick-tumaround goods at a low cost through outsourcing and complex, globalised supply chains has allowed forced labour to thrive, workers' rights advocates war, claiming that major fashion brands profiting from the model seem reluctant to change. The apparel sector employs over 60 million workers worldwide, according to the World Bank Group. And while 97 percent of fashion and retail brands have codes of conduct and corporate social responsibility (CSR) standards, such policies are neither effective in preventing forced labour nor in ensuring remedy outcomes for workers, according to advocacy group KnowThe Chain KnowTheChain's 2021 Apparel and Footwear Benchmark Report (PDF) recently ranked 37 of the world's…arrow_forwardWhat does a Balanced Workout plan ensure comprehensive fitness? What are the obstacles involved in a Balanced Workout plan to ensure comprehensive Fitness? How does mental well-being entail implementing techniques such as mindfulness, therapy, physical activity, and social support to cultivate emotional resilience and mitigate stress?arrow_forward
- Identify the ethical principles that apply to the case. Include in your discussion how each of the principles of ethical decision making as discussed in the “Underlying Principles of Ethical Patient Care” chapter factored into your decision (beneficence, non-maleficence, autonomy, respect for dignity, veracity, and justice).arrow_forwardWhat should I do? Generate Potential Actions. Include choices that cannot be justified. What justifies my choice? Decide on proper ethical action and generate responses to those with opposing arguments (Justification for your choice)arrow_forwardin the 2016 "ATB: Digital Disruption in the parking meter industry" case what recommendations would you give to adress the key issues outlined in the case?arrow_forward
- 1) JIT McDonald’s Style (https://media.gaspar.mheducation.com/GASPARPlayer/play.html?id=46KGfedfilYlJzWH4XxxbLS) What challenges did McDonald’s face with its current operating system? 2. What are the five criteria that McDonald’s new “Made for You” operating system had to meet? 3. Describe how the “Made for You” operating system works.arrow_forwardThe first general topic debated in the SHRM Learning System centers around talent acquisition and retention. Discuss how talent is different from skills, and offer two strategies a human resources professional can pursue to recruit “talent” to an organization.arrow_forwardWhat assumptions or biases do you have related to the case? Gather the facts. Known and to be gathered. Identify the stakeholders and their viewpoints. Include the values, obligations and interests of each of the stakeholders. Primary Secondaryarrow_forward
 Practical Management ScienceOperations ManagementISBN:9781337406659Author:WINSTON, Wayne L.Publisher:Cengage,
 MarketingMarketingISBN:9780357033791Author:Pride, William MPublisher:South Western Educational Publishing