
Concept explainers
Videos
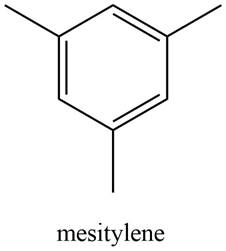
Propose a structure consistent with each set of data.
a.
b.
c.
(a)
Interpretation: A structure consistent with the given set of data is to be predicted.
Concept introduction: Spectroscopy method is used to identify the structure of the molecule. It is based on the interactions between matter and electromagnetic radiations. Proton NMR spectroscopy identifies the number of hydrogen atoms present in a molecule and the nature of the functional group. The value of chemical peaks depends upon the chemical environment around the hydrogen atom.
Answer to Problem 17.55P
A structure consistent with the given set of data is shown below.
Explanation of Solution
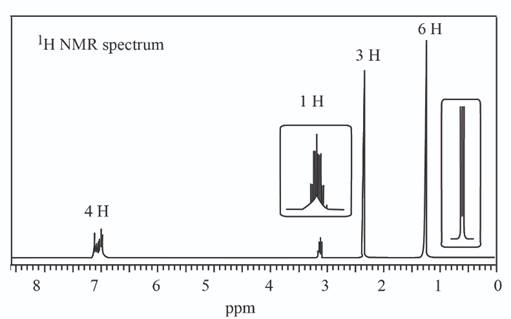
The given set of
Information from
The
Information from
The observed chemical shift value at
The observed chemical shift value at
The observed chemical shift value at
The observed chemical shift value at
The possible structure of the compound based on the above analysis is,

Figure 1
A structure consistent with the given set of data is shown in Figure 1.
(b)
Interpretation: A structure consistent with the given set of data is to be predicted.
Concept introduction: Spectroscopy method is used to identify the structure of the molecule. It is based on the interactions between matter and electromagnetic radiations. Proton NMR spectroscopy identifies the number of hydrogen atoms present in a molecule and the nature of the functional group. The value of chemical peaks depends upon the chemical environment around the hydrogen atom.
Answer to Problem 17.55P
A structure consistent with the given set of data is shown below.
Explanation of Solution
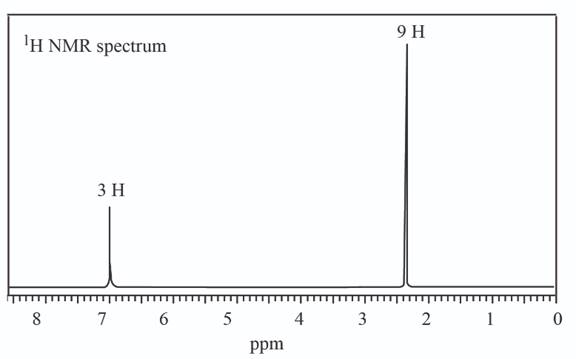
The given set of
Information from
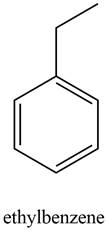
Three signals are observed in
The
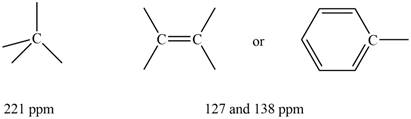
Figure 2
Information from
The observed chemical shift value at
The observed chemical shift value at
The possible structure of the compound based on the above analysis is,
Figure 3
A structure consistent with the given set of data is shown in Figure 3.
(c)
Interpretation: A structure consistent with the given set of data is to be predicted.
Concept introduction: Spectroscopy method is used to identify the structure of the molecule. It is based on the interactions between matter and electromagnetic radiations. Proton NMR spectroscopy identifies the number of hydrogen atoms present in a molecule and the nature of the functional group. The value of chemical peaks depends upon the chemical environment around the hydrogen atom.
Answer to Problem 17.55P
A structure consistent with the given set of data is shown below.
Explanation of Solution
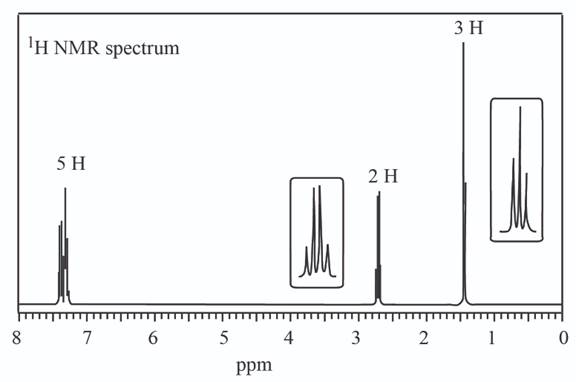
The given set of
Information from IR data:
The
Information from
The observed chemical shift value at
The observed chemical shift value at
The observed chemical shift value at
The possible structure of the compound based on the above analysis is,

Figure 4
A structure consistent with the given set of data is shown in Figure 4.
Want to see more full solutions like this?
Chapter 17 Solutions
ORGANIC CHEMISTRY


- Indicate how to prepare a 10% sodium hydroxide (NaOH) solution to a slightly alkaline pH.arrow_forwardCH, CH CH₂ CH₂ Phytyl side chain 5. What is the expected order of elution of compounds A-D below from a chromatography column packed with silica gel, eluting with hexane/ethyl acetate? C D OHarrow_forwardPlease analze my gel electrophoresis column of the VRK1 kinase (MW: 39.71 kDa). Attached is the following image for the order of column wells and my gel.arrow_forward
- 2.0arrow_forwardWrite the electron configuration of an atom of the element highlighted in this outline of the Periodic Table: 1 23 4 5 6 7 He Ne Ar Kr Xe Rn Hint: you do not need to know the name or symbol of the highlighted element! ☐arrow_forwardCompare these chromatograms of three anti-psychotic drugs done by HPLC and SFC. Why is there the difference in separation time for SFC versus HPLC? Hint, use the Van Deemter plot as a guide in answering this question. Why, fundamentally, would you expect a faster separation for SFC than HPLC, in general?arrow_forward
- A certain inorganic cation has an electrophoretic mobility of 5.27 x 10⁻⁴ cm2s-1V-1. The same ion has a diffusion coefficient of 9.5 x 10⁻⁶cm2s-1. If this ion is separated from cations by CZE with a 75cm capillary, what is the expected plate count, N, at an applied voltage of 15.0kV? Under these separation conditions, the electroosmotic flow rate was 0.85mm s-1 toward the cathode. If the detector was 50.0cm from the injection end of the capillary, how long would it take in minutes for the analyte cation to reach the detector after the field was applied?arrow_forward2.arrow_forwardPlease solve for the following Electrochemistry that occursarrow_forward
- Commercial bleach contains either chlorine or oxygen as an active ingredient. A commercial oxygenated bleach is much safer to handle and less likely to ruin your clothes. It is possible to determine the amount of active ingredient in an oxygenated bleach product by performing a redox titration. The balance reaction for such a titration is: 6H+ +5H2O2 +2MnO4- à 5O2 + 2Mn2+ + 8H2O If you performed the following procedure: “First, dilute the Seventh Generation Non-Chlorine Bleach by pipetting 10 mL of bleach in a 100 mL volumetric flask and filling the flask to the mark with distilled water. Next, pipet 10 mL of the diluted bleach solution into a 250 mL Erlenmeyer flask and add 20 mL of 1.0 M H2SO4 to the flask. This solution should be titrated with 0.0100 M KMnO4 solution.” It took 18.47mL of the KMnO4 to reach the endpoint on average. What was the concentration of H2O2 in the original bleach solution in weight % assuming the density of bleach is 1g/mL?arrow_forward10.arrow_forwardProper care of pH electrodes: Why can you not store a pH electrode in distilled water? What must you instead store it in? Why?arrow_forward

 Macroscale and Microscale Organic ExperimentsChemistryISBN:9781305577190Author:Kenneth L. Williamson, Katherine M. MastersPublisher:Brooks Cole