
Concept explainers
Videos
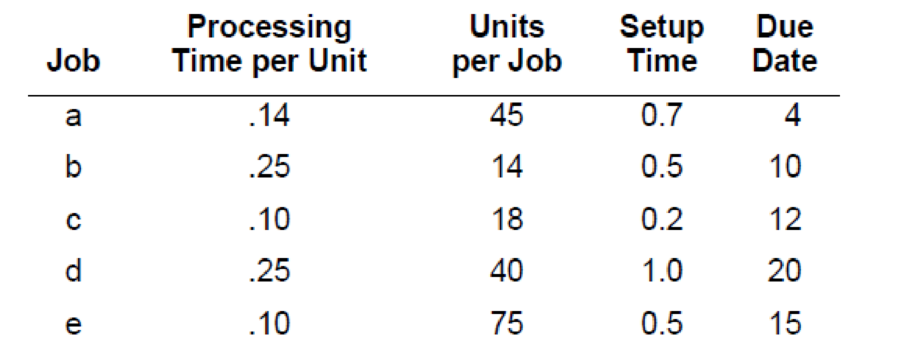
Using the information presented in the following table, identify the processing sequence that would result using (1) FCFS, (2) SPT, (3) EDD, and (4) CR. For each method, determine (1) average job flow time, (2) average job tardiness, and (3) average number of jobs in the system. Jobs are listed in order of arrival. (Hint: First determine the total job time for each job by computing the total processing time for the job and then adding in the setup time. All times and due dates are in hours.)
1)
To determine: Sequence of jobs based on decision rule First Come First Served (FCFS).
Introduction: First Come First Served is the scheduling rule, which helps to arrange the sequence in the order. Here, the first come would be served first.
Answer to Problem 7P
Explanation of Solution
Given information:
| Job | Processing time per unit | Units per job | Setup time | Due date |
| a | 0.14 | 45 | 0.7 | 4 |
| b | 0.25 | 14 | 0.5 | 10 |
| c | 0.1 | 18 | 0.2 | 12 |
| d | 0.25 | 40 | 1 | 20 |
| e | 0.1 | 75 | 0.5 | 15 |
Due date is given. Job time should be determined using the given processing time per unit, units per job, and setup time.
Example:
The procedure should be repeated for all the jobs. The resultant table is as follows:
| Job | Job time (hours) | Due date (hours) |
| a | 7 | 4 |
| b | 4 | 10 |
| c | 2 | 12 |
| d | 11 | 20 |
| e | 8 | 15 |
Determine the sequence using FCFS:
According to FCFS, the first come would be served first. Hence, the jobs should be sequenced in the order as per its arrival.
Hence, the sequence of jobs using FCFS is a-b-c-d-e.
Determine average flow time, average tardiness, and average number of jobs for FCFS:
| Job | Processing time (hours) | Due date (hours) | Flow time | Tardiness |
| a | 7 | 4 | 7 | 3 |
| b | 4 | 10 | 11 | 1 |
| c | 2 | 12 | 13 | 1 |
| d | 11 | 20 | 24 | 4 |
| e | 8 | 15 | 32 | 17 |
| Total | 32 | 61 | 87 | 26 |
| Average | 6.4 | 12.2 | 17.4 | 5.2 |
Supporting calculation:
Processing time and due date are given for each job. Flow time is the cumulative of the processing time.
Tardiness of Job a:
It is calculated by subtracting the flow time of the job from the due date of the project. Hence, the lateness of Job b is 3.
Tardiness of Job b:
It is calculated by subtracting the flow time of the job from the due date of the project. Hence, the lateness of Job b is 1.
Tardiness of Job c:
It is calculated by subtracting the flow time of the job from the due date of the project. Hence, the lateness of Job c is 1.
Tardiness of Job d:
It is calculated by subtracting the flow time of the job from the due date of the project. Hence, the lateness of Job d is 4.
Tardiness of Job e:
It is calculated by subtracting the flow time of the job from the due date of the project. Hence, the lateness of Job e is 17.
Average flow time:
It is calculated by dividing the total flow time and number of jobs.
Hence, average flow time is 17.40 hours.
Average tardiness:
It is calculated by dividing the total tardiness and number of jobs.
Hence, average tardiness is 5.20 hours.
Average number of jobs:
It can be determined by dividing the total flow time and total processing time.
Hence, average number of jobs is 2.72 jobs.
2)
To determine: Sequence of jobs based on decision rule Shortest Processing Time (SPT).
Introduction: Shortest Processing Tine is the scheduling rule, which helps to arrange the sequence in the order. Here, job with the shortest duration would be served first. Then, the process would be going on from shortest to largest duration.
Answer to Problem 7P
Explanation of Solution
Given information:
| Job | Processing time per unit | Units per job | Setup time | Due date |
| a | 0.14 | 45 | 0.7 | 4 |
| b | 0.25 | 14 | 0.5 | 10 |
| c | 0.1 | 18 | 0.2 | 12 |
| d | 0.25 | 40 | 1 | 20 |
| e | 0.1 | 75 | 0.5 | 15 |
Due date is given. Job time should be determined using the given processing time per unit, units per job, and setup time.
Example:
The procedure should be repeated for all the jobs. The resultant table is as follows:
| Job | Job time (hours) | Due date (hours) |
| a | 7 | 4 |
| b | 4 | 10 |
| c | 2 | 12 |
| d | 11 | 20 |
| e | 8 | 15 |
Determine the sequence using SPT:
According to SPT, the job that has the shortest processing would be served first and it goes on as the processing time increase. Duration should be assembled in the ascending order
Hence, the sequence of jobs using SPT is c-b-a-e-d.
Determine average flow time, average tardiness, and average number of jobs for SPT:
| Job | Job time (hours) | Due date (hours) | Flow time | Tardiness |
| c | 2 | 12 | 2 | 0 |
| b | 4 | 10 | 6 | 0 |
| a | 7 | 4 | 13 | 9 |
| e | 8 | 15 | 21 | 6 |
| d | 11 | 20 | 32 | 12 |
| Total | 32 | 61 | 74 | 27 |
| Average | 6.4 | 12.2 | 14.8 | 5.4 |
Supporting calculation:
Processing time and due date are given for each job. Flow time is the cumulative of the processing time.
Tardiness of Job c, and Job b:
Flow time of Job c and Job b is less than its respective due date. Hence, there would be no tardiness.
Tardiness of Job a:
It is calculated by subtracting the flow time of the job from the due date of the project. Hence, the lateness of Job a is 9.
Tardiness of Job e:
It is calculated by subtracting the flow time of the job from the due date of the project. Hence, the lateness of Job e is 6.
Tardiness of Job d:
It is calculated by subtracting the flow time of the job from the due date of the project. Hence, the lateness of Job d is 12.
Average flow time:
It is calculated by dividing the total flow time and number of jobs.
Hence, average flow time is 14.80 hours.
Average tardiness:
It is calculated by dividing the total tardiness and number of jobs.
Hence, average tardiness is 5.40 hours.
Average number of jobs:
It can be determined by dividing the total flow time and total processing time.
Hence, average number of jobs is 2.31 jobs.
3)
To determine: Sequence of jobs based on decision rule Earliest Due Date (EDD).
Introduction: Earliest Due Date is the scheduling rule, which helps to arrange the sequence in the order. Here, job with the earliest due date would be served first. Then, the process would be going on from earliest due date to latest due date.
Answer to Problem 7P
Explanation of Solution
Given information:
| Job | Processing time per unit | Units per job | Setup time | Due date |
| a | 0.14 | 45 | 0.7 | 4 |
| b | 0.25 | 14 | 0.5 | 10 |
| c | 0.1 | 18 | 0.2 | 12 |
| d | 0.25 | 40 | 1 | 20 |
| e | 0.1 | 75 | 0.5 | 15 |
Due date is given. Job time should be determined using the given processing time per unit, units per job, and setup time.
Example:
The procedure should be repeated for all the jobs. The resultant table is as follows:
| Job | Job time (hours) | Due date (hours) |
| a | 7 | 4 |
| b | 4 | 10 |
| c | 2 | 12 |
| d | 11 | 20 |
| e | 8 | 15 |
Determine the sequence using EDD:
According to EDD, the job that has the earliest due date would be served first and it goes on as the due date increases. The job should be arranged based on due date. Due date should be assembled in the ascending order
Hence, the sequence of jobs using EDD is a-b-c-e-d.
Determine average flow time, average tardiness, and average number of jobs for EDD:
| Job | Job time (hours) | Due date (hours) | Flow time | Tardiness |
| a | 7 | 4 | 7 | 3 |
| b | 4 | 10 | 11 | 1 |
| c | 2 | 12 | 13 | 1 |
| e | 8 | 15 | 21 | 6 |
| d | 11 | 20 | 32 | 12 |
| Total | 32 | 61 | 84 | 23 |
| Average | 6.4 | 12.2 | 16.8 | 4.6 |
Supporting calculation:
Processing time and due date are given for each job. Flow time is the cumulative of the processing time.
Tardiness of Job a:
It is calculated by subtracting the flow time of the job from the due date of the project. Hence, the lateness of Job b is 3.
Tardiness of Job b:
It is calculated by subtracting the flow time of the job from the due date of the project. Hence, the lateness of Job b is 1.
Tardiness of Job c:
It is calculated by subtracting the flow time of the job from the due date of the project. Hence, the lateness of Job c is 1.
Tardiness of Job e:
It is calculated by subtracting the flow time of the job from the due date of the project. Hence, the lateness of Job e is 6.
Tardiness of Job d:
It is calculated by subtracting the flow time of the job from the due date of the project. Hence, the lateness of Job d is 12.
Average flow time:
It is calculated by dividing the total flow time and number of jobs.
Hence, average flow time is 16.80 hours.
Average tardiness:
It is calculated by dividing the total tardiness and number of jobs.
Hence, average tardiness is 4.60 hours.
Average number of jobs:
It can be determined by dividing the total flow time and total processing time.
Hence, average number of jobs is 2.63 jobs.
4)
To determine: Sequence of jobs based on decision rule critical ratio.
Introduction: Critical ratio is kind of scheduling rule that helps to identify that, the task or job is on the correct track. It would help to identify if the task is behind or ahead of the schedule.
Answer to Problem 7P
Explanation of Solution
Given information:
| Job | Processing time per unit | Units per job | Setup time | Due date |
| a | 0.14 | 45 | 0.7 | 4 |
| b | 0.25 | 14 | 0.5 | 10 |
| c | 0.1 | 18 | 0.2 | 12 |
| d | 0.25 | 40 | 1 | 20 |
| e | 0.1 | 75 | 0.5 | 15 |
Due date is given. Job time should be determined using the given processing time per unit, units per job, and setup time.
Example:
The procedure should be repeated for all the jobs. The resultant table is as follows:
| Job | Job time (hours) | Due date (hours) |
| a | 7 | 4 |
| b | 4 | 10 |
| c | 2 | 12 |
| d | 11 | 20 |
| e | 8 | 15 |
Determine the sequence using critical ratio:
Initial critical ratio should be determined at day 0:
| Job | Processing time (hours) | Due date | Critical ratio |
| a | 7 | 4 | 0.57 |
| b | 4 | 10 | 2.5 |
| c | 2 | 12 | 6 |
| d | 11 | 20 | 1.82 |
| e | 8 | 15 | 1.88 |
Critical ratio for Job a:
It is can be determined by dividing the value attained by subtracting the completion day of previous job from the due date of current job with the processing time.
Note: Process continues for all the jobs.
Job a has the lowest critical ratio. Thus, it will be completed first. Hence, Job a would be completed first in the sequence of jobs.
Determine the critical ratio after the completion of Job a:
As the processing time of job a is 7 hours, completion day of completed day would be 7.
| Job | Processing time (hours) | Due date | Critical ratio |
| a | - | - | - |
| b | 4 | 10 | 0.75 |
| c | 2 | 12 | 2.5 |
| d | 11 | 20 | 1.18 |
| e | 8 | 15 | 1 |
Critical ratio for Job b:
It is can be determined by dividing the value attained by subtracting the completion day of completed job from the due date of current job with the processing time.
Note: Process continues for all the jobs.
Job b has the lowest critical ratio. Hence, Job b would be completed next in the sequence of jobs.
Determine the critical ratio after the completion of Job a and Job b:
As the processing time of job a is 7 hours and Job b is 4, completion day of completed day would be 11 (7+4).
| Job | Processing time (hours) | Due date | Critical ratio |
| a | - | - | - |
| b | - | - | - |
| c | 2 | 12 | 0.5 |
| d | 11 | 20 | 0.82 |
| e | 8 | 15 | 0.5 |
Critical ratio for Job c:
It is can be determined by dividing the value attained by subtracting the completion day of completed job from the due date of current job with the processing time.
Job c has the lowest critical ratio (break the tie arbitrarily). Hence, Job c would be completed next in the sequence of jobs after Job a and Job b.
Determine the critical ratio after the completion of Job a, Job b and Job c:
As the processing time of job a is 7 hours, Job b is 4, and Job c is 2 hours. completion day of completed day would be 13 (7+4+2).
| Job | Processing time (hours) | Due date | Critical ratio |
| a | - | - | - |
| b | - | - | - |
| c | - | - | - |
| d | 11 | 20 | 0.82 |
| e | 8 | 15 | 0.5 |
Critical ratio for Job d:
It is can be determined by dividing the value attained by subtracting the completion day of completed job from the due date of current job with the processing time.
Job e has the lowest critical ratio. Hence, Job e would be completed next in the sequence of jobs after Job a, Job b, and Job c.
As Job d is the remaining job, it will be completed next.
Hence, the sequence of jobs using critical ratio is a-b-c-e-d.
Average flow time:
It is calculated by dividing the total flow time and number of jobs.
Hence, average flow time is 16.80 hours.
Average tardiness:
It is calculated by dividing the total tardiness and number of jobs.
Hence, average tardiness is 4.60 hours.
Average number of jobs:
It can be determined by dividing the total flow time and total processing time.
Hence, average number of jobs is 2.63 jobs.
Want to see more full solutions like this?
Chapter 16 Solutions
Operations Management


- Cariveh Co sells automotive supplies from 25 different locations in one country. Each branch has up to 30 staff working there, although most of the accounting systems are designed and implemented from the company's head office. All accounting systems, apart from petty cash, are computerised, with the internal audit department frequently advising and implementing controls within those systems. Cariveh has an internal audit department of six staff, all of whom have been employed at Cariveh for a minimum of five years and some for as long as 15 years. In the past, the chief internal auditor appoints staff within the internal audit department, although the chief executive officer (CEO) is responsible for appointing the chief internal auditor. The chief internal auditor reports directly to the finance director. The finance director also assists the chief internal auditor in deciding on the scope of work of the internal audit department. You are an audit manager in the internal audit…arrow_forwardPlease show all steps and answers, thank you!arrow_forwardI am not sure if this is correct, because 8 cannot go directly to 10.arrow_forward
- A practical application in real life to the Critical Path Method is the construction of a bridge with references, give a detailed essay on the stages involved in constructing a bridgearrow_forwardPlease assist in writing a complete reasearch project of the following title: Title of research: Study on the impact of Technology in the Work Place.arrow_forwardIntuition is both an emotional experience and a nonconscious analytic process. One problem, however, is that not all emotions signaling that there is a problem or opportunity represent intuition. Please in your Personal opinion how we would know if our “gut feelings” are intuition or not, and if not intuition, suggest what might be causing them.arrow_forward
- A coworker suggests that the company where you both work would be much more effective if there were no organizational politics. Please in your personal and detailed opinion, What would you say to this person in reply?arrow_forwardWhat is a bottleneck? Would you try to reduce a bottleneck? Why or why not? Please provide a referencearrow_forwardYour firm has been the auditor of Caribild Products, a listed company, for a number of years. The engagement partner has asked you to describe the matters you would consider when planning the audit for the year ended 31January 2022. During recent visit to the company you obtained the following information: (a) The management accounts for the 10 months to 30 November 2021 show a revenue of $260 million and profit before tax of $8 million. Assume sales and profits accrue evenly throughout the year. In the year ended 31 January 2021 Caribild Products had sales of $220 million and profit before tax of $16 million. (b) The company installed a new computerised inventory control system which has operated from 1 June 2021. As the inventory control system records inventory movements and current inventory quantities, the company is proposing: (i) To use the inventory quantities on the computer to value the inventory at the year-end (ii) Not to carry out an inventory count at the year-end (c)…arrow_forward
- Develop and implement a complex and scientific project for an organisation of your choice. please include report include the following: Introduction Background research to the project The 5 basic phases in the project management process Project Initiation Project Planning Project Execution Project Monitoring and Controlling Project Closing Conclusionarrow_forwardNot use ai pleasearrow_forwardSam's Pet Hotel operates 51 weeks per year, 6 days per week, and uses a continuous review inventory system. It purchases kitty litter for $11.00 per bag. The following information is available about these bags: > Demand 95 bags/week > Order cost $52.00/order > Annual holding cost = 25 percent of cost > Desired cycle-service level = 80 percent >Lead time 4 weeks (24 working days) > Standard deviation of weekly demand = 15 bags > Current on-hand inventory is 320 bags, with no open orders or backorders. a. Suppose that the weekly demand forecast of 95 bags is incorrect and actual demand averages only 75 bags per week. How much higher will total costs be, owing to the distorted EOQ caused by this forecast error? The costs will be $ higher owing to the error in EOQ. (Enter your response rounded to two decimal places.)arrow_forward
 Practical Management ScienceOperations ManagementISBN:9781337406659Author:WINSTON, Wayne L.Publisher:Cengage,
 Understanding Management (MindTap Course List)ManagementISBN:9781305502215Author:Richard L. Daft, Dorothy MarcicPublisher:Cengage Learning