Concept explainers
Interpretation:
It should be determined that whether the given substance reacts with aqueous hydrochloric acid or not. If it reacts with
Concept introduction:
Depending on the number of carbon side chain of the nitrogen, different types of amines can form.
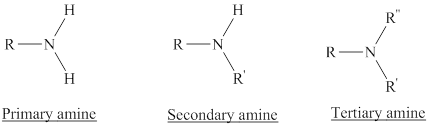
Reaction of amines and acid will give amine salt (ammonium ion).
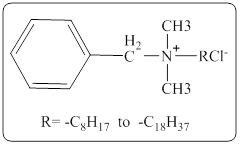
In a quaternary ammonium ion a nitrogen atom with four attached groups is positively charged. And their compounds are known as quaternary ammonium salt.
One commonly encountered quaternary ammonium salt has the following structure,
Want to see the full answer?
Check out a sample textbook solution
Chapter 16 Solutions
Pearson eText Fundamentals of General, Organic, and Biological Chemistry -- Instant Access (Pearson+)


- Problem 15 of 15 Submit Using the following reaction data points, construct Lineweaver-Burk plots for an enzyme with and without an inhibitor by dragging the points to their relevant coordinates on the graph and drawing a line of best fit. Using the information from this plot, determine the type of inhibitor present. 1 mM-1 1 s mM -1 [S]' V' with 10 μg per 20 54 10 36 20 5 27 2.5 23 1.25 20 Answer: |||arrow_forward12:33 CO Problem 4 of 15 4G 54% Done On the following Lineweaver-Burk -1 plot, identify the by dragging the Km point to the appropriate value. 1/V 40 35- 30- 25 20 15 10- T Км -15 10 -5 0 5 ||| 10 15 №20 25 25 30 1/[S] Г powered by desmosarrow_forward1:30 5G 47% Problem 10 of 15 Submit Using the following reaction data points, construct a Lineweaver-Burk plot for an enzyme with and without a competitive inhibitor by dragging the points to their relevant coordinates on the graph and drawing a line of best fit. 1 -1 1 mM [S]' s mM¹ with 10 mg pe 20 V' 54 10 36 > ст 5 27 2.5 23 1.25 20 Answer: |||arrow_forward
- Problem 14 of 15 Submit Using the following reaction data points, construct Lineweaver-Burk plots for an enzyme with and without an inhibitor by dragging the points to their relevant coordinates on the graph and drawing a line of best fit. Using the information from this plot, determine the type of inhibitor present. 1 mM-1 1 s mM -1 [S]' V' with 10 μg per 20 54 10 36 20 5 27 2.5 23 1.25 20 Answer: |||arrow_forward12:36 CO Problem 9 of 15 4G. 53% Submit Using the following reaction data points, construct a Lineweaver-Burk plot by dragging the points to their relevant coordinates on the graph and drawing a line of best fit. Based on the plot, determine the value of the catalytic efficiency (specificity constant) given that the enzyme concentration in this experiment is 5.0 μ.Μ. 1 [S] ¨‚ μM-1 1 V sμM-1 100.0 0.100 75.0 0.080 50.0 0.060 15.0 0.030 10.0 0.025 5.0 0.020 Answer: ||| O Гarrow_forwardProblem 11 of 15 Submit Using the following reaction data points, construct a Lineweaver-Burk plot for an enzyme with and without a noncompetitive inhibitor by dragging the points to their relevant coordinates on the graph and drawing a line of best fit. 1 -1 1 mM [S]' 20 V' s mM¹ with 10 μg per 54 10 36 > ст 5 27 2.5 23 1.25 20 Answer: |||arrow_forward
- Problem 13 of 15 Submit Using the following reaction data points, construct Lineweaver-Burk plots for an enzyme with and without an inhibitor by dragging the points to their relevant coordinates on the graph and drawing a line of best fit. Using the information from this plot, determine the type of inhibitor present. 1 mM-1 1 s mM -1 [S]' V' with 10 μg per 20 54 10 36 20 5 27 2.5 23 1.25 20 Answer: |||arrow_forward12:33 CO Problem 8 of 15 4G. 53% Submit Using the following reaction data points, construct a Lineweaver-Burk plot by dragging the points to their relevant coordinates on the graph and drawing a line of best fit. Based on the plot, determine the value of kcat given that the enzyme concentration in this experiment is 5.0 μM. 1 [S] , мм -1 1 V₁ s μM 1 100.0 0.100 75.0 0.080 50.0 0.060 15.0 0.030 10.0 0.025 5.0 0.020 Answer: ||| Гarrow_forward1:33 5G. 46% Problem 12 of 15 Submit Using the following reaction data points, construct a Lineweaver-Burk plot for an enzyme with and without an uncompetitive inhibitor by dragging the points to their relevant coordinates on the graph and drawing a line of best fit. 1 -1 1 mM [S]' 20 V' s mM¹ with 10 μg per 54 10 36 > ст 5 27 2.5 23 1.25 20 Answer: |||arrow_forward

 Anatomy & PhysiologyBiologyISBN:9781938168130Author:Kelly A. Young, James A. Wise, Peter DeSaix, Dean H. Kruse, Brandon Poe, Eddie Johnson, Jody E. Johnson, Oksana Korol, J. Gordon Betts, Mark WomblePublisher:OpenStax College
 Human Biology (MindTap Course List)BiologyISBN:9781305112100Author:Cecie Starr, Beverly McMillanPublisher:Cengage Learning
 Biology Today and Tomorrow without Physiology (Mi...BiologyISBN:9781305117396Author:Cecie Starr, Christine Evers, Lisa StarrPublisher:Cengage LearningEssentials of Pharmacology for Health ProfessionsNursingISBN:9781305441620Author:WOODROWPublisher:Cengage