The visitors’ guide to St. Petersburg, Florida, contains the chart shown in Figure 1.77 to advertise their good weather. Fit a trigonometric function approximately to the data, where H is temperature in degrees Fahrenheit, and the independent variable is time in months. In order to do this, you will need to estimate the amplitude and period of the data, and when the maximum occurs. (There are many possible answers to this problem, depending on how you read the graph.) Figure 1.77: “St. Petersburg...where we’re famous for our wonderful weather and year-round sunshine.” (Reprinted with permission)
The visitors’ guide to St. Petersburg, Florida, contains the chart shown in Figure 1.77 to advertise their good weather. Fit a trigonometric function approximately to the data, where H is temperature in degrees Fahrenheit, and the independent variable is time in months. In order to do this, you will need to estimate the amplitude and period of the data, and when the maximum occurs. (There are many possible answers to this problem, depending on how you read the graph.) Figure 1.77: “St. Petersburg...where we’re famous for our wonderful weather and year-round sunshine.” (Reprinted with permission)
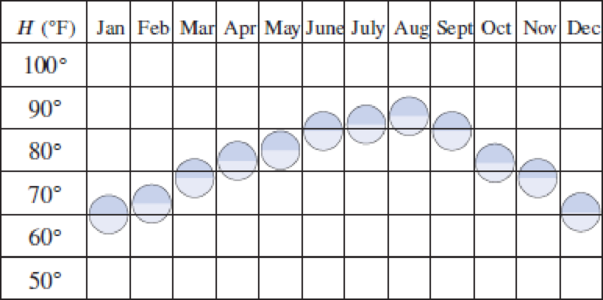
The visitors’ guide to St. Petersburg, Florida, contains the chart shown in Figure 1.77 to advertise their good weather. Fit a trigonometric function approximately to the data, where H is temperature in degrees Fahrenheit, and the independent variable is time in months. In order to do this, you will need to estimate the amplitude and period of the data, and when the maximum occurs. (There are many possible answers to this problem, depending on how you read the graph.)
Figure 1.77: “St. Petersburg...where we’re famous for our wonderful weather and year-round sunshine.” (Reprinted with permission)
A body of mass m at the top of a 100 m high tower is thrown vertically upward with an initial velocity of 10 m/s. Assume that the air resistance FD acting on the body is proportional to the velocity V, so that FD=kV. Taking g = 9.75 m/s2 and k/m = 5 s, determine: a) what height the body will reach at the top of the tower, b) how long it will take the body to touch the ground, and c) the velocity of the body when it touches the ground.
A chemical reaction involving the interaction of two substances A and B to form a new compound X is called a second order reaction. In such cases it is observed that the rate of reaction (or the rate at which the new compound is formed) is proportional to the product of the remaining amounts of the two original substances. If a molecule of A and a molecule of B combine to form a molecule of X (i.e., the reaction equation is A + B ⮕ X), then the differential equation describing this specific reaction can be expressed as:
dx/dt = k(a-x)(b-x)
where k is a positive constant, a and b are the initial concentrations of the reactants A and B, respectively, and x(t) is the concentration of the new compound at any time t. Assuming that no amount of compound X is present at the start, obtain a relationship for x(t). What happens when t ⮕∞?
Consider a body of mass m dropped from rest at t = 0. The body falls under the influence of gravity, and the air resistance FD opposing the motion is assumed to be proportional to the square of the velocity, so that FD = kV2. Call x the vertical distance and take the positive direction of the x-axis downward, with origin at the initial position of the body. Obtain relationships for the velocity and position of the body as a function of time t.
Need a deep-dive on the concept behind this application? Look no further. Learn more about this topic, calculus and related others by exploring similar questions and additional content below.
Fundamental Trigonometric Identities: Reciprocal, Quotient, and Pythagorean Identities; Author: Mathispower4u;https://www.youtube.com/watch?v=OmJ5fxyXrfg;License: Standard YouTube License, CC-BY


 Algebra & Trigonometry with Analytic GeometryAlgebraISBN:9781133382119Author:SwokowskiPublisher:Cengage
 Mathematics For Machine TechnologyAdvanced MathISBN:9781337798310Author:Peterson, John.Publisher:Cengage Learning,
 Algebra and Trigonometry (MindTap Course List)AlgebraISBN:9781305071742Author:James Stewart, Lothar Redlin, Saleem WatsonPublisher:Cengage Learning