Views on Capital Punishment In carrying out a study of views on capital punishment, a student asked a question two ways: 1. With persuasion: “My brother has been accused of murder and he is innocent. If he is found guilty, he might suffer capital punishment. Now do you support or oppose capital punishment?” 2. Without persuasion: “Do you support or oppose capital punishment?” Here is a breakdown of her actual data. Men Women a. What percentage of those persuaded against it support capital punishment? b. What percentage of those not persuaded against it support capital punishment? c. Compare the percentages in parts a and b . Is this what you expected? Explain.
Views on Capital Punishment In carrying out a study of views on capital punishment, a student asked a question two ways: 1. With persuasion: “My brother has been accused of murder and he is innocent. If he is found guilty, he might suffer capital punishment. Now do you support or oppose capital punishment?” 2. Without persuasion: “Do you support or oppose capital punishment?” Here is a breakdown of her actual data. Men Women a. What percentage of those persuaded against it support capital punishment? b. What percentage of those not persuaded against it support capital punishment? c. Compare the percentages in parts a and b . Is this what you expected? Explain.
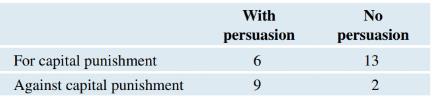
Views on Capital Punishment In carrying out a study of views on capital punishment, a student asked a question two ways:
1. With persuasion: “My brother has been accused of murder and he is innocent. If he is found guilty, he might suffer capital punishment. Now do you support or oppose capital punishment?”
2. Without persuasion: “Do you support or oppose capital punishment?”
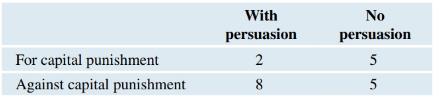
Here is a breakdown of her actual data.
Men
Women
a. What percentage of those persuaded against it support capital punishment?
b. What percentage of those not persuaded against it support capital punishment?
c. Compare the percentages in parts
a
and
b
.
Is this what you expected? Explain.
NC Current Students - North Ce X | NC Canvas Login Links - North ( X
Final Exam Comprehensive x Cengage Learning
x
WASTAT - Final Exam - STAT
→
C
webassign.net/web/Student/Assignment-Responses/submit?dep=36055360&tags=autosave#question3659890_9
Part (b)
Draw a scatter plot of the ordered pairs.
N
Life
Expectancy
Life
Expectancy
80
70
600
50
40
30
20
10
Year of
1950
1970 1990
2010 Birth
O
Life
Expectancy
Part (c)
800
70
60
50
40
30
20
10
1950
1970 1990
W
ALT
林
$
#
4
R
J7
Year of
2010 Birth
F6
4+
80
70
60
50
40
30
20
10
Year of
1950 1970 1990
2010 Birth
Life
Expectancy
Ox
800
70
60
50
40
30
20
10
Year of
1950 1970 1990 2010 Birth
hp
P.B.
KA
&
7
80
% 5
H
A
B
F10
711
N
M
K
744
PRT SC
ALT
CTRL
A Problem Solving Approach To Mathematics For Elementary School Teachers (13th Edition)
Knowledge Booster
Learn more about
Need a deep-dive on the concept behind this application? Look no further. Learn more about this topic, statistics and related others by exploring similar questions and additional content below.


 Glencoe Algebra 1, Student Edition, 9780079039897...AlgebraISBN:9780079039897Author:CarterPublisher:McGraw Hill
 Functions and Change: A Modeling Approach to Coll...AlgebraISBN:9781337111348Author:Bruce Crauder, Benny Evans, Alan NoellPublisher:Cengage Learning
 Big Ideas Math A Bridge To Success Algebra 1: Stu...AlgebraISBN:9781680331141Author:HOUGHTON MIFFLIN HARCOURTPublisher:Houghton Mifflin Harcourt