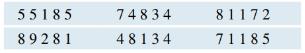
Proportion of Odd Digits A large collection of one-digit random numbers should have about 50 % odd and 50 % even digits, because five of the ten digits are odd 1 , 3 , 5 , 7 , and 9 and five are even 0 , 2 , 4 , 6 , and 8 . a. Find the proportion of odd-numbered digits in the following lines from a random number table. Count carefully. b. Does the proportion found in part a represent p ^ (the sample proportion) or p (the population proportion)? c. Find the error in this estimate, the difference between p ^ and p (or p ^ − p ).
Proportion of Odd Digits A large collection of one-digit random numbers should have about 50 % odd and 50 % even digits, because five of the ten digits are odd 1 , 3 , 5 , 7 , and 9 and five are even 0 , 2 , 4 , 6 , and 8 . a. Find the proportion of odd-numbered digits in the following lines from a random number table. Count carefully. b. Does the proportion found in part a represent p ^ (the sample proportion) or p (the population proportion)? c. Find the error in this estimate, the difference between p ^ and p (or p ^ − p ).
Solution Summary: The author calculates the proportion of odd-numbered digits in the random number table, which is 0.57, and determines whether it is a sample or population proportion.
Proportion of Odd Digits A large collection of one-digit random numbers should have about
50
%
odd and
50
%
even digits, because five of the ten digits are odd
1
,
3
,
5
,
7
,
and
9
and five are even
0
,
2
,
4
,
6
,
and
8
.
a. Find the proportion of odd-numbered digits in the following lines from a random number table. Count carefully.
b. Does the proportion found in part a represent
p
^
(the sample proportion) or
p
(the population proportion)?
c. Find the error in this estimate, the difference between
p
^
and
p
(or
p
^
−
p
).
NC Current Students - North Ce X | NC Canvas Login Links - North ( X
Final Exam Comprehensive x Cengage Learning
x
WASTAT - Final Exam - STAT
→
C
webassign.net/web/Student/Assignment-Responses/submit?dep=36055360&tags=autosave#question3659890_9
Part (b)
Draw a scatter plot of the ordered pairs.
N
Life
Expectancy
Life
Expectancy
80
70
600
50
40
30
20
10
Year of
1950
1970 1990
2010 Birth
O
Life
Expectancy
Part (c)
800
70
60
50
40
30
20
10
1950
1970 1990
W
ALT
林
$
#
4
R
J7
Year of
2010 Birth
F6
4+
80
70
60
50
40
30
20
10
Year of
1950 1970 1990
2010 Birth
Life
Expectancy
Ox
800
70
60
50
40
30
20
10
Year of
1950 1970 1990 2010 Birth
hp
P.B.
KA
&
7
80
% 5
H
A
B
F10
711
N
M
K
744
PRT SC
ALT
CTRL
Harvard University
California Institute of Technology
Massachusetts Institute of Technology
Stanford University
Princeton University
University of Cambridge
University of Oxford
University of California, Berkeley
Imperial College London
Yale University
University of California, Los Angeles
University of Chicago
Johns Hopkins University
Cornell University
ETH Zurich
University of Michigan
University of Toronto
Columbia University
University of Pennsylvania
Carnegie Mellon University
University of Hong Kong
University College London
University of Washington
Duke University
Northwestern University
University of Tokyo
Georgia Institute of Technology
Pohang University of Science and Technology
University of California, Santa Barbara
University of British Columbia
University of North Carolina at Chapel Hill
University of California, San Diego
University of Illinois at Urbana-Champaign
National University of Singapore
McGill…
Need a deep-dive on the concept behind this application? Look no further. Learn more about this topic, statistics and related others by exploring similar questions and additional content below.


 Holt Mcdougal Larson Pre-algebra: Student Edition...AlgebraISBN:9780547587776Author:HOLT MCDOUGALPublisher:HOLT MCDOUGAL
 Glencoe Algebra 1, Student Edition, 9780079039897...AlgebraISBN:9780079039897Author:CarterPublisher:McGraw Hill
 College Algebra (MindTap Course List)AlgebraISBN:9781305652231Author:R. David Gustafson, Jeff HughesPublisher:Cengage Learning

 Big Ideas Math A Bridge To Success Algebra 1: Stu...AlgebraISBN:9781680331141Author:HOUGHTON MIFFLIN HARCOURTPublisher:Houghton Mifflin Harcourt