
Introductory Statistics
3rd Edition
ISBN: 9780135188927
Author: Gould, Robert, Ryan, Colleen N. (colleen Nooter)
Publisher: Pearson,
expand_more
expand_more
format_list_bulleted
Concept explainers
Videos
Textbook Question
Chapter 7, Problem 37SE
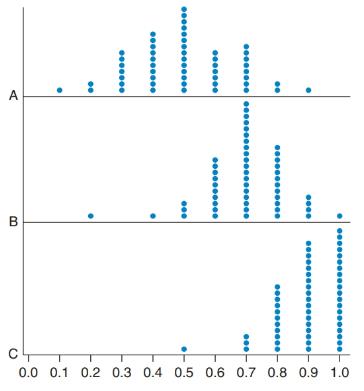
Fair Coin? One of the graphs shows the proportion of heads from flipping a fair coin 10 times, repeatedly. The others do not. Which graph represents the coin flips? Explain how you know.
Expert Solution & Answer
Want to see the full answer?
Check out a sample textbook solution
Students have asked these similar questions
Test the claim that a student's pulse rate is different when taking a quiz than attending a regular class. The mean pulse rate difference is 2.7 with 10 students. Use a significance level of 0.005.
Pulse rate difference(Quiz - Lecture)
2
-1
5
-8
1
20
15
-4
9
-12
The following ordered data list shows the data speeds for cell phones used by a
telephone company at an airport:
A. Calculate the Measures of Central Tendency from the ungrouped data list.
B. Group the data in an appropriate frequency table.
C. Calculate the Measures of Central Tendency using the table in point B.
D. Are there differences in the measurements obtained in A and C? Why (give at
least one justified reason)?
I leave the answers to A and B to resolve the remaining two.
0.8
1.4
1.8
1.9
3.2
3.6
4.5
4.5
4.6
6.2
6.5
7.7
7.9
9.9
10.2
10.3
10.9
11.1
11.1
11.6
11.8
12.0
13.1
13.5
13.7
14.1
14.2
14.7
15.0
15.1
15.5
15.8
16.0
17.5
18.2
20.2
21.1
21.5
22.2
22.4
23.1
24.5
25.7
28.5
34.6
38.5
43.0
55.6
71.3
77.8
A. Measures of Central Tendency
We are to calculate:
Mean, Median, Mode
The data (already ordered) is:
0.8, 1.4, 1.8, 1.9, 3.2, 3.6, 4.5, 4.5, 4.6, 6.2, 6.5, 7.7, 7.9, 9.9, 10.2, 10.3, 10.9,
11.1, 11.1, 11.6,
11.8, 12.0, 13.1, 13.5, 13.7, 14.1, 14.2, 14.7, 15.0, 15.1, 15.5,…
PEER REPLY 1:
Choose a classmate's Main Post.
1. Indicate a range of values for the independent variable (x) that is reasonable
based on the data provided.
2. Explain what the predicted range of dependent values should be based on
the range of independent values.
Chapter 7 Solutions
Introductory Statistics
Ch. 7 - Population vs. Sample (Example 1) In 2017 the...Ch. 7 - Population vs. Sample In 2017 Pew Research Center...Ch. 7 - Parameter vs. Statistic (Example 2) Bob Ross...Ch. 7 - Parameter vs. Statistic The website...Ch. 7 - x vs. Two symbols are used for the mean: and x....Ch. 7 - vs. s Two symbols are used for the standard...Ch. 7 - vs. x The mean weight of all professional NBA...Ch. 7 - vs. s The standard deviation of all professional...Ch. 7 - Notation (Example 3) The city of San Francisco...Ch. 7 - Notation The city of Chicago provides an open data...
Ch. 7 - Samples and Populations (Example 4) Chapman...Ch. 7 - Samples and Populations The Centers for Disease...Ch. 7 - Sample vs. Census You are receiving a large...Ch. 7 - Sampling GPAs Suppose you want to estimate the...Ch. 7 - Sampling with and without Replacement Explain the...Ch. 7 - Simple Random Sampling Is simple random sampling...Ch. 7 - Finding a Random Sample (Example 5) You need to...Ch. 7 - Finding a Random Sample You need to select a...Ch. 7 - Random Sampling Assume your class has 30 students...Ch. 7 - Random Sampling with Coins Assume your class has...Ch. 7 - Survey Response (Example 6) A school district...Ch. 7 - Survey Response To determine if patrons are...Ch. 7 - Views on Capital Punishment In carrying out a...Ch. 7 - Views on Capital Punishment Use the data given in...Ch. 7 - Targets: Bias or Lack of Precision? a. If a...Ch. 7 - Targets: Bias or Lack of Precision, Again a. If a...Ch. 7 - Bias? Suppose that, when taking a random sample of...Ch. 7 - Unbiased Sample? Suppose you attend a school that...Ch. 7 - Proportion of Odd Digits A large collection of...Ch. 7 - Proportion of Odd Digits...Ch. 7 - Prob. 31SECh. 7 - Prob. 32SECh. 7 - ESP A Zener deck of cards has cards that show one...Ch. 7 - ESP Again In the graphs for Exercise 7.33, explain...Ch. 7 - Standard Error Which of the dotplots given in...Ch. 7 - Bias? Assuming that the true proportion of success...Ch. 7 - Fair Coin? One of the graphs shows the proportion...Ch. 7 - Far from Fair Which of the graphs in Exercise 7.37...Ch. 7 - Variation in Sample Proportions (Example 7)...Ch. 7 - Variation in Sample Proportions Suppose it is...Ch. 7 - Driver’s License (Example 8) According to a 2017...Ch. 7 - BA Attainment According to a 2017 Pew Research...Ch. 7 - Stress (Example 9) According to a 2017 Gallup...Ch. 7 - Prob. 44SECh. 7 - Streaming Services (Example 10) According to a...Ch. 7 - Prob. 46SECh. 7 - Voting According to a 2017 Pew Research Center...Ch. 7 - Instagram According to a 2018 Pew Research Center...Ch. 7 - Super Bowl In 2018 it was estimated that...Ch. 7 - College Enrollment According to data released in...Ch. 7 - Color Blindness While the majority of people who...Ch. 7 - Blood Type Human blood is divided into 8 possible...Ch. 7 - Prob. 53SECh. 7 - Environment A 2017 Gallup poll found that 601 out...Ch. 7 - Gun Control According to a 2017 Gallup Poll, 617...Ch. 7 - Smokers According to a 2017 Gallup poll, 572 out...Ch. 7 - Voting A random sample of likely voters showed...Ch. 7 - Voting A random sample of likely voters showed...Ch. 7 - Prob. 59SECh. 7 - Diabetes In a simple random sample of 1200...Ch. 7 - Marijuana Legalization A 2017 Gallup poll reported...Ch. 7 - Organic Produce A 2016 Pew Research poll found...Ch. 7 - Democracy and Unpopular Views A 2017 survey of...Ch. 7 - Democracy and Free Press A 2017 survey of U.S....Ch. 7 - Winter Olympics (Example 12) According to a 2018...Ch. 7 - Marijuana Use The Gallup poll reported that 45 of...Ch. 7 - Past Presidential Vote In the 1960 presidential...Ch. 7 - Batting Averages The website www.mlb.com compiles...Ch. 7 - Picky Eaters (Example 13) In a 2017 Harris poll...Ch. 7 - Nutrition Labels Of 1019 U.S. adults responding to...Ch. 7 - Prob. 71SECh. 7 - Estimating Sample Size In the 2018 study Closing...Ch. 7 - Happiness A Harris poll asked Americans in 2016...Ch. 7 - Artificial Intelligence A Harris poll asked a...Ch. 7 - Democratic (Examples 15, 16, 17, 18) Voters and...Ch. 7 - Trust in Judiciary In 2016 and 2017 Gallup asked...Ch. 7 - Perry Preschool and Graduation from High School...Ch. 7 - Preschool: Just the Boys Refer to Exercise 7.77...Ch. 7 - Prob. 79SECh. 7 - Sugar-Sweetened Beverages In 2017, the journal...Ch. 7 - Gender and Use of Turn Signals Statistics student...Ch. 7 - Local TV News Pew Research reported that 46 of...Ch. 7 - Drug for Nausea Ondansetron (Zofran) is a drug...Ch. 7 - Preschool: Just the Girls The Perry Preschool...Ch. 7 - Prob. 85CRECh. 7 - College Enrollment (Women) According to the Bureau...Ch. 7 - Prob. 87CRECh. 7 - Technology Anxiety In a 2018 survey conducted by...Ch. 7 - Sample Proportion A poll on a proposition showed...Ch. 7 - Sample Proportion A poll on a proposition showed...Ch. 7 - Margin of Error A poll on a proposition showed...Ch. 7 - Margin of Error A poll on a proposition showed...Ch. 7 - Dreaming in Color According to studies done in the...Ch. 7 - Hand Washing Ignaz Semmelweiss (1818-1865) was the...Ch. 7 - Prob. 95CRECh. 7 - School Bond Suppose a political consultant is...Ch. 7 - Prob. 97CRECh. 7 - Prob. 98CRECh. 7 - Voters Poll: Sample Size A polling agency wants to...Ch. 7 - Ratio of Sample Sizes Find the sample size...Ch. 7 - Criticize the Sampling Marco is interested in...Ch. 7 - Criticize the Sampling Maria opposes capital...Ch. 7 - Random Sampling? If you walked around your school...Ch. 7 - Biased Sample? You want to find the mean weight of...Ch. 7 - Bias? Suppose that, when taking a random sample of...Ch. 7 - Bias? Four women selected from a photo of 123 were...Ch. 7 - Sample Size Formula (Part 1) From Formula 7.2, an...Ch. 7 - Sample Size Formula (Part 2) Using your result...
Additional Math Textbook Solutions
Find more solutions based on key concepts
(a) Make a stem-and-leaf plot for these 24 observations on the number of customers who used a down-town CitiBan...
APPLIED STAT.IN BUS.+ECONOMICS
First Derivative Test a. Locale the critical points of f. b. Use the First Derivative Test to locale the local ...
Calculus: Early Transcendentals (2nd Edition)
For Problems 23-28, write in simpler form, as in Example 4. logbFG
Finite Mathematics for Business, Economics, Life Sciences and Social Sciences
1. How is a sample related to a population?
Elementary Statistics: Picturing the World (7th Edition)
Knowledge Booster


Learn more about
Need a deep-dive on the concept behind this application? Look no further. Learn more about this topic, statistics and related others by exploring similar questions and additional content below.Similar questions
- In a company with 80 employees, 60 earn $10.00 per hour and 20 earn $13.00 per hour. Is this average hourly wage considered representative?arrow_forwardThe following is a list of questions answered correctly on an exam. Calculate the Measures of Central Tendency from the ungrouped data list. NUMBER OF QUESTIONS ANSWERED CORRECTLY ON AN APTITUDE EXAM 112 72 69 97 107 73 92 76 86 73 126 128 118 127 124 82 104 132 134 83 92 108 96 100 92 115 76 91 102 81 95 141 81 80 106 84 119 113 98 75 68 98 115 106 95 100 85 94 106 119arrow_forwardThe following ordered data list shows the data speeds for cell phones used by a telephone company at an airport: A. Calculate the Measures of Central Tendency using the table in point B. B. Are there differences in the measurements obtained in A and C? Why (give at least one justified reason)? 0.8 1.4 1.8 1.9 3.2 3.6 4.5 4.5 4.6 6.2 6.5 7.7 7.9 9.9 10.2 10.3 10.9 11.1 11.1 11.6 11.8 12.0 13.1 13.5 13.7 14.1 14.2 14.7 15.0 15.1 15.5 15.8 16.0 17.5 18.2 20.2 21.1 21.5 22.2 22.4 23.1 24.5 25.7 28.5 34.6 38.5 43.0 55.6 71.3 77.8arrow_forward
- In a company with 80 employees, 60 earn $10.00 per hour and 20 earn $13.00 per hour. a) Determine the average hourly wage. b) In part a), is the same answer obtained if the 60 employees have an average wage of $10.00 per hour? Prove your answer.arrow_forwardThe following ordered data list shows the data speeds for cell phones used by a telephone company at an airport: A. Calculate the Measures of Central Tendency from the ungrouped data list. B. Group the data in an appropriate frequency table. 0.8 1.4 1.8 1.9 3.2 3.6 4.5 4.5 4.6 6.2 6.5 7.7 7.9 9.9 10.2 10.3 10.9 11.1 11.1 11.6 11.8 12.0 13.1 13.5 13.7 14.1 14.2 14.7 15.0 15.1 15.5 15.8 16.0 17.5 18.2 20.2 21.1 21.5 22.2 22.4 23.1 24.5 25.7 28.5 34.6 38.5 43.0 55.6 71.3 77.8arrow_forwardBusinessarrow_forward
- https://www.hawkeslearning.com/Statistics/dbs2/datasets.htmlarrow_forwardNC Current Students - North Ce X | NC Canvas Login Links - North ( X Final Exam Comprehensive x Cengage Learning x WASTAT - Final Exam - STAT → C webassign.net/web/Student/Assignment-Responses/submit?dep=36055360&tags=autosave#question3659890_9 Part (b) Draw a scatter plot of the ordered pairs. N Life Expectancy Life Expectancy 80 70 600 50 40 30 20 10 Year of 1950 1970 1990 2010 Birth O Life Expectancy Part (c) 800 70 60 50 40 30 20 10 1950 1970 1990 W ALT 林 $ # 4 R J7 Year of 2010 Birth F6 4+ 80 70 60 50 40 30 20 10 Year of 1950 1970 1990 2010 Birth Life Expectancy Ox 800 70 60 50 40 30 20 10 Year of 1950 1970 1990 2010 Birth hp P.B. KA & 7 80 % 5 H A B F10 711 N M K 744 PRT SC ALT CTRLarrow_forwardHarvard University California Institute of Technology Massachusetts Institute of Technology Stanford University Princeton University University of Cambridge University of Oxford University of California, Berkeley Imperial College London Yale University University of California, Los Angeles University of Chicago Johns Hopkins University Cornell University ETH Zurich University of Michigan University of Toronto Columbia University University of Pennsylvania Carnegie Mellon University University of Hong Kong University College London University of Washington Duke University Northwestern University University of Tokyo Georgia Institute of Technology Pohang University of Science and Technology University of California, Santa Barbara University of British Columbia University of North Carolina at Chapel Hill University of California, San Diego University of Illinois at Urbana-Champaign National University of Singapore McGill…arrow_forward
- Name Harvard University California Institute of Technology Massachusetts Institute of Technology Stanford University Princeton University University of Cambridge University of Oxford University of California, Berkeley Imperial College London Yale University University of California, Los Angeles University of Chicago Johns Hopkins University Cornell University ETH Zurich University of Michigan University of Toronto Columbia University University of Pennsylvania Carnegie Mellon University University of Hong Kong University College London University of Washington Duke University Northwestern University University of Tokyo Georgia Institute of Technology Pohang University of Science and Technology University of California, Santa Barbara University of British Columbia University of North Carolina at Chapel Hill University of California, San Diego University of Illinois at Urbana-Champaign National University of Singapore…arrow_forwardA company found that the daily sales revenue of its flagship product follows a normal distribution with a mean of $4500 and a standard deviation of $450. The company defines a "high-sales day" that is, any day with sales exceeding $4800. please provide a step by step on how to get the answers in excel Q: What percentage of days can the company expect to have "high-sales days" or sales greater than $4800? Q: What is the sales revenue threshold for the bottom 10% of days? (please note that 10% refers to the probability/area under bell curve towards the lower tail of bell curve) Provide answers in the yellow cellsarrow_forwardFind the critical value for a left-tailed test using the F distribution with a 0.025, degrees of freedom in the numerator=12, and degrees of freedom in the denominator = 50. A portion of the table of critical values of the F-distribution is provided. Click the icon to view the partial table of critical values of the F-distribution. What is the critical value? (Round to two decimal places as needed.)arrow_forward
arrow_back_ios
SEE MORE QUESTIONS
arrow_forward_ios
Recommended textbooks for you
 Glencoe Algebra 1, Student Edition, 9780079039897...AlgebraISBN:9780079039897Author:CarterPublisher:McGraw Hill
 Holt Mcdougal Larson Pre-algebra: Student Edition...AlgebraISBN:9780547587776Author:HOLT MCDOUGALPublisher:HOLT MCDOUGAL
 Big Ideas Math A Bridge To Success Algebra 1: Stu...AlgebraISBN:9781680331141Author:HOUGHTON MIFFLIN HARCOURTPublisher:Houghton Mifflin Harcourt
 Algebra: Structure And Method, Book 1AlgebraISBN:9780395977224Author:Richard G. Brown, Mary P. Dolciani, Robert H. Sorgenfrey, William L. ColePublisher:McDougal Littell

Glencoe Algebra 1, Student Edition, 9780079039897...
Algebra
ISBN:9780079039897
Author:Carter
Publisher:McGraw Hill
Holt Mcdougal Larson Pre-algebra: Student Edition...
Algebra
ISBN:9780547587776
Author:HOLT MCDOUGAL
Publisher:HOLT MCDOUGAL
Big Ideas Math A Bridge To Success Algebra 1: Stu...
Algebra
ISBN:9781680331141
Author:HOUGHTON MIFFLIN HARCOURT
Publisher:Houghton Mifflin Harcourt
Algebra: Structure And Method, Book 1
Algebra
ISBN:9780395977224
Author:Richard G. Brown, Mary P. Dolciani, Robert H. Sorgenfrey, William L. Cole
Publisher:McDougal Littell
Use of ALGEBRA in REAL LIFE; Author: Fast and Easy Maths !;https://www.youtube.com/watch?v=9_PbWFpvkDc;License: Standard YouTube License, CC-BY
Compound Interest Formula Explained, Investment, Monthly & Continuously, Word Problems, Algebra; Author: The Organic Chemistry Tutor;https://www.youtube.com/watch?v=P182Abv3fOk;License: Standard YouTube License, CC-BY
Applications of Algebra (Digit, Age, Work, Clock, Mixture and Rate Problems); Author: EngineerProf PH;https://www.youtube.com/watch?v=Y8aJ_wYCS2g;License: Standard YouTube License, CC-BY