
Calculus: Single And Multivariable
7th Edition
ISBN: 9781119444190
Author: Hughes-Hallett, Deborah; Mccallum, William G.; Gleason, Andrew M.; Connally, Eric; Kalaycioglu, Selin; Flath, Daniel E.; Lahme, Brigitte; Lomen, David O.; Lock, Patti Frazer; Lovelock, David; Morris, Jerry; Lozano, Guadalupe I.; Mumford, David; Quinney, D
Publisher: WILEY
expand_more
expand_more
format_list_bulleted
Concept explainers
Videos
Textbook Question
Chapter 1.1, Problem 69E
A bakery owner knows that customers buy a total of q cakes when the price, p, is no more than p = d(q) = 20 − q∕20 dollars. She is willing to make and supply as many as q cakes at a price of p = s(q) = 11 + q∕40 dollars each. (The graphs of the functions d(q) and s(q) are called a demand curve and a supply curve, respectively.) The graphs of d(q) and s(q) are in Figure 1.22.
- (a) Why, in terms of the context, is the slope of d(q) negative and the slope of s(q) positive?
- (b) Is each of the ordered pairs (q, p) a solution to the inequality p ≤ 20 − q∕20? Interpret your answers in terms of the context.
(60, 18) (120, 12)
- (c) Graph in the qp-plane the solution set of the system of inequalities p ≤ 20 − q∕20, p ≥ 11 + q∕40. What does this solution set represent in terms of the context?
- (d) What is the rightmost point of the solution set you graphed in part (c)? Interpret your answer in terms of the context.
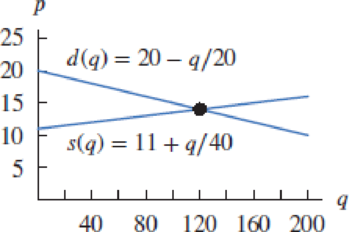
Figure 1.22
Expert Solution & Answer
Want to see the full answer?
Check out a sample textbook solution
Students have asked these similar questions
8–23. Sketching vector fields Sketch the following vector fields
25-30. Normal and tangential components For the vector field F and
curve C, complete the following:
a. Determine the points (if any) along the curve C at which the vector
field F is tangent to C.
b. Determine the points (if any) along the curve C at which the vector
field F is normal to C.
c. Sketch C and a few representative vectors of F on C.
25. F
=
(2½³, 0); c = {(x, y); y −
x² =
1}
26. F
=
x
(23 - 212) ; C = {(x, y); y = x² = 1})
,
2
27. F(x, y); C = {(x, y): x² + y² = 4}
28. F = (y, x); C = {(x, y): x² + y² = 1}
29. F = (x, y); C =
30. F = (y, x); C =
{(x, y): x = 1}
{(x, y): x² + y² = 1}
٣/١
B
msl
kd
180
Ka, Sin (1)
I sin ()
sin(30)
Sin (30)
اذا ميريد شرح الكتب بس 0 بالفراغ
3) Cos (30) 0.866
4) Rotating
5) Synchronous speed, 120 x 50
G
5005
1000
s = 1000-950
Copper bosses 5kW
Rotor input
5
0.05
: loo kw
6) 1
/0001
ined sove in peaper
I need a detailed
solution on paper
please
وه
اذا ميريد شرح الكتب فقط ١٥٠
DC
7) rotor
a
' (y+xlny + xe*)dx + (xsiny + xlnx + dy = 0.
Q1// Find the solution of: (
357
Chapter 1 Solutions
Calculus: Single And Multivariable
Ch. 1.1 - The population of a city, P, in millions, is a...Ch. 1.1 - The pollutant PCB (polychlorinated biphenyl) can...Ch. 1.1 - Describe what Figure 1.8 tells you about an...Ch. 1.1 - For Exercises 47, find an equation for the line...Ch. 1.1 - For Exercises 47, find an equation for the line...Ch. 1.1 - For Exercises 47, find an equation for the line...Ch. 1.1 - For Exercises 47, find an equation for the line...Ch. 1.1 - For Exercises 811, determine the slope and the...Ch. 1.1 - For Exercises 811, determine the slope and the...Ch. 1.1 - For Exercises 811, determine the slope and the...
Ch. 1.1 - For Exercises 811, determine the slope and the...Ch. 1.1 - Match the graphs in Figure 1.9 with the following...Ch. 1.1 - Match the graphs in Figure 1.10 with the following...Ch. 1.1 - Estimate the slope and the equation of the line in...Ch. 1.1 - Find an equation for the line with slope m through...Ch. 1.1 - Find a linear function that generates the values...Ch. 1.1 - For Exercises 1719, use the facts that parallel...Ch. 1.1 - For Exercises 1719, use the facts that parallel...Ch. 1.1 - For Exercises 1719, use the facts that parallel...Ch. 1.1 - For Exercises 2023, give the approximate domain...Ch. 1.1 - For Exercises 2023, give the approximate domain...Ch. 1.1 - For Exercises 2023, give the approximate domain...Ch. 1.1 - For Exercises 2023, give the approximate domain...Ch. 1.1 - Prob. 24ECh. 1.1 - Prob. 25ECh. 1.1 - If f(t)=t216, find all values of t for which f(t)...Ch. 1.1 - In Exercises 2731, write a formula representing...Ch. 1.1 - In Exercises 2731, write a formula representing...Ch. 1.1 - In Exercises 2731, write a formula representing...Ch. 1.1 - In Exercises 2731, write a formula representing...Ch. 1.1 - In Exercises 2731, write a formula representing...Ch. 1.1 - In December 2010, the snowfall in Minneapolis was...Ch. 1.1 - The value of a car, V = f(a), in thousands of...Ch. 1.1 - Which graph in Figure 1.13 best matches each of...Ch. 1.1 - In Problems 3538 the function S = f(t) gives the...Ch. 1.1 - In Problems 3538 the function S = f(t) gives the...Ch. 1.1 - In Problems 3538 the function S = f(t) gives the...Ch. 1.1 - In Problems 3538 the function S = f(t) gives the...Ch. 1.1 - Problems 3942 ask you to plot graphs based on the...Ch. 1.1 - Problems 3942 ask you to plot graphs based on the...Ch. 1.1 - Problems 3942 ask you to plot graphs based on the...Ch. 1.1 - Problems 3942 ask you to plot graphs based on the...Ch. 1.1 - An object is put outside on a cold day at time t =...Ch. 1.1 - A rock is dropped from a window and falls to the...Ch. 1.1 - You drive at a constant speed from Chicago to...Ch. 1.1 - US imports of crude oil and petroleum have been...Ch. 1.1 - Problems 4749 use Figure 1.16 showing how the...Ch. 1.1 - Problems 4749 use Figure 1.16 showing how the...Ch. 1.1 - Problems 4749 use Figure 1.16 showing how the...Ch. 1.1 - Marmots are large squirrels that hibernate in the...Ch. 1.1 - In Colorado spring has arrived when the bluebell...Ch. 1.1 - On March 5, 2015, Capracotta, Italy, received 256...Ch. 1.1 - In a California town, the monthly charge for waste...Ch. 1.1 - For tax purposes, you may have to report the value...Ch. 1.1 - Residents of the town of Maple Grove who are...Ch. 1.1 - A controversial 1992 Danish study10 reported that...Ch. 1.1 - Let f(t) be the number of US billionaires in year...Ch. 1.1 - The cost of planting seed is usually a function of...Ch. 1.1 - An airplane uses a fixed amount of fuel for take...Ch. 1.1 - For the line y = f(x) in Figure 1.19, evaluate (a)...Ch. 1.1 - For the line y = g(x) in Figure 1.20, evaluate (a)...Ch. 1.1 - An alternative to petroleum-based diesel fuel,...Ch. 1.1 - Hydroelectric power is electric power generated by...Ch. 1.1 - Solar panels are arrays of photovoltaic cells that...Ch. 1.1 - Table 1.4 shows the average annual sea level, S,...Ch. 1.1 - The table gives the required standard weight, w,...Ch. 1.1 - A company rents cars at 40 a day and 15 cents a...Ch. 1.1 - A 25,000 vehicle depreciates 2000 a year as it...Ch. 1.1 - A bakery owner knows that customers buy a total of...Ch. 1.1 - (a) Consider the functions graphed in Figure...Ch. 1.1 - When Galileo was formulating the laws of motion,...Ch. 1.1 - In Problems 7276, explain what is wrong with the...Ch. 1.1 - In Problems 7276, explain what is wrong with the...Ch. 1.1 - In Problems 7276, explain what is wrong with the...Ch. 1.1 - In Problems 7276, explain what is wrong with the...Ch. 1.1 - In Problems 7276, explain what is wrong with the...Ch. 1.1 - In Problems 7778, give an example of: A linear...Ch. 1.1 - In Problems 7778, give an example of: A formula...Ch. 1.1 - Are the statements in Problems 7984 true or false?...Ch. 1.1 - Are the statements in Problems 7984 true or false?...Ch. 1.1 - Are the statements in Problems 7984 true or false?...Ch. 1.1 - Are the statements in Problems 7984 true or false?...Ch. 1.1 - Are the statements in Problems 7984 true or false?...Ch. 1.1 - Are the statements in Problems 7984 true or false?...Ch. 1.1 - Which of the following functions has its domain...Ch. 1.2 - In Exercises 14, decide whether the graph is...Ch. 1.2 - In Exercises 14, decide whether the graph is...Ch. 1.2 - In Exercises 14, decide whether the graph is...Ch. 1.2 - In Exercises 14, decide whether the graph is...Ch. 1.2 - The functions in Exercises 58 represent...Ch. 1.2 - The functions in Exercises 58 represent...Ch. 1.2 - The functions in Exercises 58 represent...Ch. 1.2 - The functions in Exercises 58 represent...Ch. 1.2 - Write the functions in Exercises 912 in the form P...Ch. 1.2 - Write the functions in Exercises 912 in the form P...Ch. 1.2 - Write the functions in Exercises 912 in the form P...Ch. 1.2 - Write the functions in Exercises 912 in the form P...Ch. 1.2 - In Exercises 1314, let f(t) = Q0at = Q0(1 + r)t....Ch. 1.2 - In Exercises 1314, let f(t) = Q0at = Q0(1 + r)t....Ch. 1.2 - A town has a population of 1000 people at time t =...Ch. 1.2 - An air-freshener starts with 30 grams and...Ch. 1.2 - For which pairs of consecutive points in Figure...Ch. 1.2 - The table gives the average temperature in...Ch. 1.2 - (a) Which (if any) of the functions in the...Ch. 1.2 - In Problems 2021, find all the tables that have...Ch. 1.2 - In Problems 2021, find all the tables that have...Ch. 1.2 - Table 1.10 shows some values of a linear function...Ch. 1.2 - Match the functions (s), f(s), and g(s), whose...Ch. 1.2 - Each of the functions g, h, k in Table 1.12 is...Ch. 1.2 - Each of the functions in Table 1.13 decreases, but...Ch. 1.2 - Figure 1.36 shows Q = 50(1.2)t, Q = 50(0.6)t , Q =...Ch. 1.2 - In Problems 2732, give a possible formula for the...Ch. 1.2 - In Problems 2732, give a possible formula for the...Ch. 1.2 - In Problems 2732, give a possible formula for the...Ch. 1.2 - In Problems 2732, give a possible formula for the...Ch. 1.2 - In Problems 2732, give a possible formula for the...Ch. 1.2 - In Problems 2732, give a possible formula for the...Ch. 1.2 - The table gives the number of North American...Ch. 1.2 - When a new product is advertised, more and more...Ch. 1.2 - Sketch reasonable graphs for the following. Pay...Ch. 1.2 - (a) A population, P, grows at a continuous rate of...Ch. 1.2 - A 2008 study of 300 oil fields producing a total...Ch. 1.2 - In 2014, the worlds population reached 7.17...Ch. 1.2 - Aircraft require longer takeoff distances, called...Ch. 1.2 - One of the main contaminants of a nuclear...Ch. 1.2 - A certain region has a population of 10,000,000...Ch. 1.2 - According to the EPA, sales of electronic devices...Ch. 1.2 - (a) Estimate graphically the doubling time of the...Ch. 1.2 - A deposit of P0 into a bank account has a doubling...Ch. 1.2 - A 325 mg aspirin has a half-life of H hours in a...Ch. 1.2 - (a) The half-life of radium-226 is 1620 years. If...Ch. 1.2 - In the early 1960s, radioactive strontium-90 was...Ch. 1.2 - Food bank usage in Britain has grown dramatically...Ch. 1.2 - Problems 5051 concern biodiesel, a fuel derived...Ch. 1.2 - Problems 5051 concern biodiesel, a fuel derived...Ch. 1.2 - Hydroelectric power is electric power generated by...Ch. 1.2 - Problems 5354 concern wind power, which has been...Ch. 1.2 - Problems 5354 concern wind power, which has been...Ch. 1.2 - (a) The exponential functions in Figure 1.39 have...Ch. 1.2 - In Problems 5659, explain what is wrong with the...Ch. 1.2 - In Problems 5659, explain what is wrong with the...Ch. 1.2 - In Problems 5659, explain what is wrong with the...Ch. 1.2 - In Problems 5659, explain what is wrong with the...Ch. 1.2 - In Problems 6064, give an example of: A decreasing...Ch. 1.2 - In Problems 6064, give an example of: A formula...Ch. 1.2 - In Problems 6064, give an example of: A function...Ch. 1.2 - In Problems 6064, give an example of: A function...Ch. 1.2 - In Problems 6064, give an example of: An...Ch. 1.2 - Are the statements in Problems 6572 true or false?...Ch. 1.2 - Are the statements in Problems 6572 true or false?...Ch. 1.2 - Are the statements in Problems 6572 true or false?...Ch. 1.2 - Are the statements in Problems 6572 true or false?...Ch. 1.2 - Are the statements in Problems 6572 true or false?...Ch. 1.2 - Are the statements in Problems 6572 true or false?...Ch. 1.2 - Are the statements in Problems 6572 true or false?...Ch. 1.2 - Are the statements in Problems 6572 true or false?...Ch. 1.3 - For the functions f in Exercises 13, graph:...Ch. 1.3 - For the functions f in Exercises 13, graph:...Ch. 1.3 - For the functions f in Exercises 13, graph:...Ch. 1.3 - In Exercises 47, use Figure 1.46 to graph the...Ch. 1.3 - In Exercises 47, use Figure 1.46 to graph the...Ch. 1.3 - In Exercises 47, use Figure 1.46 to graph the...Ch. 1.3 - In Exercises 47, use Figure 1.46 to graph the...Ch. 1.3 - Use Figure 1.47 to graph each of the following....Ch. 1.3 - For the functions f and g in Exercises 912, find...Ch. 1.3 - For the functions f and g in Exercises 912, find...Ch. 1.3 - For the functions f and g in Exercises 912, find...Ch. 1.3 - For the functions f and g in Exercises 912, find...Ch. 1.3 - If f(x)=x2+1, find and simplify:...Ch. 1.3 - For g(x)=x2+2x+3, find and simplify:...Ch. 1.3 - Simplify the quantities in Exercises 1518 using...Ch. 1.3 - Simplify the quantities in Exercises 1518 using...Ch. 1.3 - Simplify the quantities in Exercises 1518 using...Ch. 1.3 - Simplify the quantities in Exercises 1518 using...Ch. 1.3 - Are the functions in Exercises 1926 even, odd, or...Ch. 1.3 - Are the functions in Exercises 1926 even, odd, or...Ch. 1.3 - Are the functions in Exercises 1926 even, odd, or...Ch. 1.3 - Are the functions in Exercises 1926 even, odd, or...Ch. 1.3 - Are the functions in Exercises 1926 even, odd, or...Ch. 1.3 - Are the functions in Exercises 1926 even, odd, or...Ch. 1.3 - Are the functions in Exercises 1926 even, odd, or...Ch. 1.3 - Are the functions in Exercises 1926 even, odd, or...Ch. 1.3 - For Exercises 2728, decide if the function y =...Ch. 1.3 - For Exercises 2728, decide if the function y =...Ch. 1.3 - For Exercises 2931, use a graph of the function to...Ch. 1.3 - For Exercises 2931, use a graph of the function to...Ch. 1.3 - For Exercises 2931, use a graph of the function to...Ch. 1.3 - Let p be the price of an item and q be the number...Ch. 1.3 - Let C = f(A) be the cost, in dollars, of building...Ch. 1.3 - Let f(x) be the temperature (F) when the column of...Ch. 1.3 - (a) Write an equation for a graph obtained by...Ch. 1.3 - How does the graph of Q = S(1 ekt) in Example 4...Ch. 1.3 - In Problems 3738 find possible formulas for the...Ch. 1.3 - In Problems 3738 find possible formulas for the...Ch. 1.3 - In Problems 3942, use Figure 1.48 to estimate the...Ch. 1.3 - In Problems 3942, use Figure 1.48 to estimate the...Ch. 1.3 - In Problems 3942, use Figure 1.48 to estimate the...Ch. 1.3 - In Problems 3942, use Figure 1.48 to estimate the...Ch. 1.3 - For Problems 4348, use the graphs in Figure 1.49....Ch. 1.3 - For Problems 4348, use the graphs in Figure 1.49....Ch. 1.3 - For Problems 4348, use the graphs in Figure 1.49....Ch. 1.3 - For Problems 4348, use the graphs in Figure 1.49....Ch. 1.3 - For Problems 4348, use the graphs in Figure 1.49....Ch. 1.3 - For Problems 4348, use the graphs in Figure 1.49....Ch. 1.3 - For Problems 4952, determine functions f and g...Ch. 1.3 - For Problems 4952, determine functions f and g...Ch. 1.3 - For Problems 4952, determine functions f and g...Ch. 1.3 - For Problems 4952, determine functions f and g...Ch. 1.3 - A tree of height y meters has, on average, B...Ch. 1.3 - Prob. 54ECh. 1.3 - Complete the following table with values for the...Ch. 1.3 - Write a table of values for f1, where f is as...Ch. 1.3 - (a) Use Figure 1.50 to estimate f1(2). (b) Sketch...Ch. 1.3 - For Problems 5861, decide if the function f is...Ch. 1.3 - For Problems 5861, decide if the function f is...Ch. 1.3 - For Problems 5861, decide if the function f is...Ch. 1.3 - For Problems 5861, decide if the function f is...Ch. 1.3 - In Problems 6266, interpret the expression in...Ch. 1.3 - In Problems 6266, interpret the expression in...Ch. 1.3 - In Problems 6266, interpret the expression in...Ch. 1.3 - In Problems 6266, interpret the expression in...Ch. 1.3 - In Problems 6266, interpret the expression in...Ch. 1.3 - In Problems 6770 the functions r = f(t) and V =...Ch. 1.3 - In Problems 6770 the functions r = f(t) and V =...Ch. 1.3 - In Problems 6770 the functions r = f(t) and V =...Ch. 1.3 - In Problems 6770 the functions r = f(t) and V =...Ch. 1.3 - The cost of producing q articles is given by the...Ch. 1.3 - Figure 1.51 shows f(t), the number (in millions)...Ch. 1.3 - Figure 1.52 is a graph of the function f(t). Here...Ch. 1.3 - Figure 1.53 shows graphs of 4 useful functions:...Ch. 1.3 - In Problems 7579, explain what is wrong with the...Ch. 1.3 - In Problems 7579, explain what is wrong with the...Ch. 1.3 - In Problems 7579, explain what is wrong with the...Ch. 1.3 - In Problems 7579, explain what is wrong with the...Ch. 1.3 - In Problems 7579, explain what is wrong with the...Ch. 1.3 - In Problems 8083, give an example of: An...Ch. 1.3 - In Problems 8083, give an example of: An even...Ch. 1.3 - In Problems 8083, give an example of: An...Ch. 1.3 - In Problems 8083, give an example of: Two...Ch. 1.3 - Are the statements in Problems 8493 true or false?...Ch. 1.3 - Are the statements in Problems 8493 true or false?...Ch. 1.3 - Are the statements in Problems 8493 true or false?...Ch. 1.3 - Are the statements in Problems 8493 true or false?...Ch. 1.3 - Are the statements in Problems 8493 true or false?...Ch. 1.3 - Are the statements in Problems 8493 true or false?...Ch. 1.3 - Are the statements in Problems 8493 true or false?...Ch. 1.3 - Are the statements in Problems 8493 true or false?...Ch. 1.3 - Are the statements in Problems 8493 true or false?...Ch. 1.3 - Are the statements in Problems 8493 true or false?...Ch. 1.3 - In Problems 9497, suppose f is an increasing...Ch. 1.3 - In Problems 9497, suppose f is an increasing...Ch. 1.3 - In Problems 9497, suppose f is an increasing...Ch. 1.3 - In Problems 9497, suppose f is an increasing...Ch. 1.4 - In Exercises 16, simplify the expression...Ch. 1.4 - In Exercises 16, simplify the expression...Ch. 1.4 - In Exercises 16, simplify the expression...Ch. 1.4 - In Exercises 16, simplify the expression...Ch. 1.4 - In Exercises 16, simplify the expression...Ch. 1.4 - In Exercises 16, simplify the expression...Ch. 1.4 - For Exercises 718, solve for x using logs. 3x=11Ch. 1.4 - For Exercises 718, solve for x using logs. 17x=2Ch. 1.4 - For Exercises 718, solve for x using logs....Ch. 1.4 - For Exercises 718, solve for x using logs. 43x=75xCh. 1.4 - For Exercises 718, solve for x using logs....Ch. 1.4 - For Exercises 718, solve for x using logs. 2x=ex+1Ch. 1.4 - For Exercises 718, solve for x using logs....Ch. 1.4 - For Exercises 718, solve for x using logs....Ch. 1.4 - For Exercises 718, solve for x using logs....Ch. 1.4 - For Exercises 718, solve for x using logs....Ch. 1.4 - For Exercises 718, solve for x using logs....Ch. 1.4 - For Exercises 718, solve for x using logs....Ch. 1.4 - For Exercises 1924, solve for t. Assume a and b...Ch. 1.4 - For Exercises 1924, solve for t. Assume a and b...Ch. 1.4 - For Exercises 1924, solve for t. Assume a and b...Ch. 1.4 - For Exercises 1924, solve for t. Assume a and b...Ch. 1.4 - For Exercises 1924, solve for t. Assume a and b...Ch. 1.4 - For Exercises 1924, solve for t. Assume a and b...Ch. 1.4 - In Exercises 2528, put the functions in the form...Ch. 1.4 - In Exercises 2528, put the functions in the form...Ch. 1.4 - In Exercises 2528, put the functions in the form...Ch. 1.4 - In Exercises 2528, put the functions in the form...Ch. 1.4 - Find the inverse function in Exercises 2931....Ch. 1.4 - Find the inverse function in Exercises 2931....Ch. 1.4 - Find the inverse function in Exercises 2931....Ch. 1.4 - The exponential function y(x) = Cex satisfies the...Ch. 1.4 - Prob. 33ECh. 1.4 - Prob. 34ECh. 1.4 - A culture of bacteria originally numbers 500....Ch. 1.4 - One hundred kilograms of a radioactive substance...Ch. 1.4 - The population of the US was 281.4 million in 2000...Ch. 1.4 - The population of a region is growing...Ch. 1.4 - Oil consumption in China grew exponentially38 from...Ch. 1.4 - The concentration of the car exhaust fume nitrous...Ch. 1.4 - For children and adults with diseases such as...Ch. 1.4 - The number of alternative fuel vehicles41 running...Ch. 1.4 - A cup of coffee contains 100 mg of caffeine, which...Ch. 1.4 - Persistent organic pollutants (POPS) are a serious...Ch. 1.4 - At time t hours after taking the cough suppressant...Ch. 1.4 - Different isotopes (versions) of the same element...Ch. 1.4 - The size of an exponentially growing bacteria...Ch. 1.4 - Air pressure, P, decreases exponentially with...Ch. 1.4 - With time, t, in years since the start of 1980,...Ch. 1.4 - In November 2010, a tiger summit was held in St....Ch. 1.4 - In 2014, the populations of China and India were...Ch. 1.4 - The revenue of Apple went from54.5 billion in 2013...Ch. 1.4 - The world population was 6.9 billion at the end of...Ch. 1.4 - In the early 1920s, Germany had tremendously high...Ch. 1.4 - In 2010, there were about 246 million vehicles...Ch. 1.4 - Tiny marine organisms reproduce at different...Ch. 1.4 - A picture supposedly painted by Vermeer (16321675)...Ch. 1.4 - Cyanide is used in solution to isolate gold in a...Ch. 1.4 - In 2015, Nepal had two massive earthquakes, the...Ch. 1.4 - Find the equation of the line l in Figure 1.57....Ch. 1.4 - Without a calculator or computer, match the...Ch. 1.4 - Is there a difference between ln(ln(x)) and...Ch. 1.4 - If h(x)=ln(x+a), where a 0, what is the effect of...Ch. 1.4 - If h(x)=ln(x+a), where a 0, what is the effect of...Ch. 1.4 - If g(x)=ln(ax+2), where a 0, what is the effect...Ch. 1.4 - If f(x)=aln(x+2), what is the effect of increasing...Ch. 1.4 - If g(x)=ln(ax+2) where a 0, what is the effect of...Ch. 1.4 - Show that the growth rate k of the exponential...Ch. 1.4 - In Problems 6974, explain what is wrong with the...Ch. 1.4 - In Problems 6974, explain what is wrong with the...Ch. 1.4 - In Problems 6974, explain what is wrong with the...Ch. 1.4 - In Problems 6974, explain what is wrong with the...Ch. 1.4 - In Problems 6974, explain what is wrong with the...Ch. 1.4 - In Problems 6974, explain what is wrong with the...Ch. 1.4 - In Problems 7577, give an example of: A function...Ch. 1.4 - In Problems 7577, give an example of: A function...Ch. 1.4 - In Problems 7577, give an example of: A function...Ch. 1.4 - Are the statements in Problems 7881 true or false?...Ch. 1.4 - Are the statements in Problems 7881 true or false?...Ch. 1.4 - Are the statements in Problems 7881 true or false?...Ch. 1.4 - Are the statements in Problems 7881 true or false?...Ch. 1.5 - For Exercises 19, draw the angle using a ray...Ch. 1.5 - For Exercises 19, draw the angle using a ray...Ch. 1.5 - For Exercises 19, draw the angle using a ray...Ch. 1.5 - For Exercises 19, draw the angle using a ray...Ch. 1.5 - For Exercises 19, draw the angle using a ray...Ch. 1.5 - For Exercises 19, draw the angle using a ray...Ch. 1.5 - For Exercises 19, draw the angle using a ray...Ch. 1.5 - For Exercises 19, draw the angle using a ray...Ch. 1.5 - For Exercises 19, draw the angle using a ray...Ch. 1.5 - Find the period and amplitude in Exercises 1013....Ch. 1.5 - Find the period and amplitude in Exercises 1013....Ch. 1.5 - Find the period and amplitude in Exercises 1013....Ch. 1.5 - Find the period and amplitude in Exercises 1013....Ch. 1.5 - For Exercises 1423, find a possible formula for...Ch. 1.5 - For Exercises 1423, find a possible formula for...Ch. 1.5 - For Exercises 1423, find a possible formula for...Ch. 1.5 - For Exercises 1423, find a possible formula for...Ch. 1.5 - For Exercises 1423, find a possible formula for...Ch. 1.5 - For Exercises 1423, find a possible formula for...Ch. 1.5 - For Exercises 1423, find a possible formula for...Ch. 1.5 - For Exercises 1423, find a possible formula for...Ch. 1.5 - For Exercises 1423, find a possible formula for...Ch. 1.5 - For Exercises 1423, find a possible formula for...Ch. 1.5 - In Exercises 2429, calculate the quantity without...Ch. 1.5 - In Exercises 2429, calculate the quantity without...Ch. 1.5 - In Exercises 2429, calculate the quantity without...Ch. 1.5 - In Exercises 2429, calculate the quantity without...Ch. 1.5 - In Exercises 2429, calculate the quantity without...Ch. 1.5 - In Exercises 2429, calculate the quantity without...Ch. 1.5 - In Exercises 3034, find a solution to the equation...Ch. 1.5 - In Exercises 3034, find a solution to the equation...Ch. 1.5 - In Exercises 3034, find a solution to the equation...Ch. 1.5 - In Exercises 3034, find a solution to the equation...Ch. 1.5 - In Exercises 3034, find a solution to the equation...Ch. 1.5 - What is the period of the earths revolution around...Ch. 1.5 - What is the approximate period of the moons...Ch. 1.5 - When a cars engine makes less than about 200...Ch. 1.5 - A compact disc spins at a rate of 200 to 500...Ch. 1.5 - Find the angle, in degrees, that a wheelchair ramp...Ch. 1.5 - (a) Use a graphing calculator or computer to...Ch. 1.5 - Without a calculator or computer, match the...Ch. 1.5 - Figure 1.73 shows four periodic functions of the...Ch. 1.5 - In Problems 4349, graph the given function on the...Ch. 1.5 - In Problems 4349, graph the given function on the...Ch. 1.5 - In Problems 4349, graph the given function on the...Ch. 1.5 - In Problems 4349, graph the given function on the...Ch. 1.5 - In Problems 4349, graph the given function on the...Ch. 1.5 - In Problems 4349, graph the given function on the...Ch. 1.5 - In Problems 4349, graph the given function on the...Ch. 1.5 - For Problems 5053, use Figure 1.75 to estimate the...Ch. 1.5 - For Problems 5053, use Figure 1.75 to estimate the...Ch. 1.5 - For Problems 5053, use Figure 1.75 to estimate the...Ch. 1.5 - For Problems 5053, use Figure 1.75 to estimate the...Ch. 1.5 - For Problems 5457, use Figure 1.75 to estimate the...Ch. 1.5 - For Problems 5457, use Figure 1.75 to estimate the...Ch. 1.5 - For Problems 5457, use Figure 1.75 to estimate the...Ch. 1.5 - For Problems 5457, use Figure 1.75 to estimate the...Ch. 1.5 - The visitors guide to St. Petersburg, Florida,...Ch. 1.5 - What is the difference between sin x2, sin2 x, and...Ch. 1.5 - On the graph of y = sin x, points P and Q are at...Ch. 1.5 - A population of animals oscillates sinusoidally...Ch. 1.5 - The desert temperature, H, oscillates daily...Ch. 1.5 - The depth of water in a tank oscillates...Ch. 1.5 - The voltage, V, of an electrical outlet in a home...Ch. 1.5 - The power output, P, of a solar panel varies with...Ch. 1.5 - A baseball hit at an angle of to the horizontal...Ch. 1.5 - (a) Match the functions = f(t), = g(t), = (t), ...Ch. 1.5 - For a boat to float in a tidal bay, the water must...Ch. 1.5 - The Bay of Fundy in Canada has the largest tides...Ch. 1.5 - Match graphs A-D in Figure 1.78 with the functions...Ch. 1.5 - In Figure 1.79, the blue curve shows monthly mean...Ch. 1.5 - Find the area of the trapezoidal cross-section of...Ch. 1.5 - Graph y = sin x, y = 0.4, and y = 0.4. (a) From...Ch. 1.5 - This problem introduces the arccosine function, or...Ch. 1.5 - In Problems 7578, explain what is wrong with the...Ch. 1.5 - In Problems 7578, explain what is wrong with the...Ch. 1.5 - In Problems 7578, explain what is wrong with the...Ch. 1.5 - In Problems 7578, explain what is wrong with the...Ch. 1.5 - In Problems 7980, give an example of: A sine...Ch. 1.5 - In Problems 7980, give an example of: A cosine...Ch. 1.5 - Are the statements in Problems 8197 true or false?...Ch. 1.5 - Are the statements in Problems 8197 true or false?...Ch. 1.5 - Are the statements in Problems 8197 true or false?...Ch. 1.5 - Are the statements in Problems 8197 true or false?...Ch. 1.5 - Are the statements in Problems 8197 true or false?...Ch. 1.5 - Are the statements in Problems 8197 true or false?...Ch. 1.5 - Are the statements in Problems 8197 true or false?...Ch. 1.5 - Are the statements in Problems 8197 true or false?...Ch. 1.5 - Are the statements in Problems 8197 true or false?...Ch. 1.5 - Are the statements in Problems 8197 true or false?...Ch. 1.5 - Are the statements in Problems 8197 true or false?...Ch. 1.5 - Are the statements in Problems 8197 true or false?...Ch. 1.5 - Are the statements in Problems 8197 true or false?...Ch. 1.5 - Are the statements in Problems 8197 true or false?...Ch. 1.5 - Are the statements in Problems 8197 true or false?...Ch. 1.5 - Are the statements in Problems 8197 true or false?...Ch. 1.5 - Are the statements in Problems 8197 true or false?...Ch. 1.6 - For Exercises 12, what happens to the value of the...Ch. 1.6 - For Exercises 12, what happens to the value of the...Ch. 1.6 - In Exercises 310, determine the end behavior of...Ch. 1.6 - In Exercises 310, determine the end behavior of...Ch. 1.6 - In Exercises 310, determine the end behavior of...Ch. 1.6 - In Exercises 310, determine the end behavior of...Ch. 1.6 - In Exercises 310, determine the end behavior of...Ch. 1.6 - In Exercises 310, determine the end behavior of...Ch. 1.6 - In Exercises 310, determine the end behavior of...Ch. 1.6 - In Exercises 310, determine the end behavior of...Ch. 1.6 - In Exercises 1116, which function dominates as x ...Ch. 1.6 - In Exercises 1116, which function dominates as x ...Ch. 1.6 - In Exercises 1116, which function dominates as x ...Ch. 1.6 - In Exercises 1116, which function dominates as x ...Ch. 1.6 - In Exercises 1116, which function dominates as x ...Ch. 1.6 - In Exercises 1116, which function dominates as x ...Ch. 1.6 - Each of the graphs in Figure 1.89 is of a...Ch. 1.6 - Find cubic polynomials for the graphs in Exercises...Ch. 1.6 - Find cubic polynomials for the graphs in Exercises...Ch. 1.6 - Find possible formulas for the graphs in Exercises...Ch. 1.6 - Find possible formulas for the graphs in Exercises...Ch. 1.6 - Find possible formulas for the graphs in Exercises...Ch. 1.6 - Find possible formulas for the graphs in Exercises...Ch. 1.6 - In Exercises 2426, choose the functions that are...Ch. 1.6 - In Exercises 2426, choose the functions that are...Ch. 1.6 - In Exercises 2426, choose the functions that are...Ch. 1.6 - In Exercises 2732, choose each of the families the...Ch. 1.6 - In Exercises 2732, choose each of the families the...Ch. 1.6 - In Exercises 2732, choose each of the families the...Ch. 1.6 - In Exercises 2732, choose each of the families the...Ch. 1.6 - In Exercises 2732, choose each of the families the...Ch. 1.6 - In Exercises 2732, choose each of the families the...Ch. 1.6 - In Exercises 3340, which of the following...Ch. 1.6 - In Exercises 3340, which of the following...Ch. 1.6 - In Exercises 3340, which of the following...Ch. 1.6 - In Exercises 3340, which of the following...Ch. 1.6 - In Exercises 3340, which of the following...Ch. 1.6 - In Exercises 3340, which of the following...Ch. 1.6 - In Exercises 3340, which of the following...Ch. 1.6 - In Exercises 3340, which of the following...Ch. 1.6 - For Exercises 4144, assuming the window is large...Ch. 1.6 - For Exercises 4144, assuming the window is large...Ch. 1.6 - For Exercises 4144, assuming the window is large...Ch. 1.6 - For Exercises 4144, assuming the window is large...Ch. 1.6 - How many distinct roots can a polynomial of degree...Ch. 1.6 - Find a calculator window in which the graphs of...Ch. 1.6 - A cubic polynomial with positive leading...Ch. 1.6 - (a) If f(x)=ax2+bx+c, what can you say about the...Ch. 1.6 - A box of fixed volume V has a square base with...Ch. 1.6 - Prob. 50ECh. 1.6 - The DuBois formula relates a persons surface area...Ch. 1.6 - According to Car and Driver, an Alfa Romeo going...Ch. 1.6 - Poiseuilles Law gives the rate of flow, R, of a...Ch. 1.6 - A pomegranate is thrown from ground level straight...Ch. 1.6 - The height of an object above the ground at time t...Ch. 1.6 - The rate, R, at which a population in a confined...Ch. 1.6 - In Problems 5761, the length of a plant, L, is a...Ch. 1.6 - In Problems 5761, the length of a plant, L, is a...Ch. 1.6 - In Problems 5761, the length of a plant, L, is a...Ch. 1.6 - In Problems 5761, the length of a plant, L, is a...Ch. 1.6 - In Problems 5761, the length of a plant, L, is a...Ch. 1.6 - In Problems 6264, find all horizontal and vertical...Ch. 1.6 - In Problems 6264, find all horizontal and vertical...Ch. 1.6 - In Problems 6264, find all horizontal and vertical...Ch. 1.6 - For each function, fill in the blanks in the...Ch. 1.6 - A rational function y = f(x) is graphed in Figure...Ch. 1.6 - After running 3miles at a speed of x mph, a man...Ch. 1.6 - Which of the functions IIII meet each of the...Ch. 1.6 - Values of three functions are given in Table 1.19,...Ch. 1.6 - Use a graphing calculator or a computer to graph y...Ch. 1.6 - Prob. 71ECh. 1.6 - When an object of mass m moves with a velocity v...Ch. 1.6 - If y = 100x0.2 and z = ln x, explain why y is an...Ch. 1.6 - In Problems 7479, explain what is wrong with the...Ch. 1.6 - In Problems 7479, explain what is wrong with the...Ch. 1.6 - In Problems 7479, explain what is wrong with the...Ch. 1.6 - In Problems 7479, explain what is wrong with the...Ch. 1.6 - In Problems 7479, explain what is wrong with the...Ch. 1.6 - In Problems 7479, explain what is wrong with the...Ch. 1.6 - In Problems 8085, give an example of: polynomial...Ch. 1.6 - In Problems 8085, give an example of: A rational...Ch. 1.6 - In Problems 8085, give an example of: A rational...Ch. 1.6 - In Problems 8085, give an example of: A function...Ch. 1.6 - In Problems 8085, give an example of: A function...Ch. 1.6 - In Problems 8085, give an example of: A function...Ch. 1.6 - Are the statements in Problems 8689 true or false?...Ch. 1.6 - Are the statements in Problems 8689 true or false?...Ch. 1.6 - Are the statements in Problems 8689 true or false?...Ch. 1.6 - Are the statements in Problems 8689 true or false?...Ch. 1.6 - List the following functions in order from...Ch. 1.7 - (a) Using Figure 1.108, find all values of x for...Ch. 1.7 - (a) Using Figure 1.109, find all values of x for...Ch. 1.7 - Use the graph of f(x) in Figure 1.110 to give...Ch. 1.7 - In Exercises 45, the graph of y = f(x) is given....Ch. 1.7 - In Exercises 45, the graph of y = f(x) is given....Ch. 1.7 - Assume f(x) is continuous on an interval around x...Ch. 1.7 - Assume g(t) is continuous on an interval around t...Ch. 1.7 - In Exercises 89, (a) Make a table of values of...Ch. 1.7 - In Exercises 89, (a) Make a table of values of...Ch. 1.7 - Use a table of values to estimate limx1(5+lnx).Ch. 1.7 - In Exercises 1116, is the function continuous on...Ch. 1.7 - In Exercises 1116, is the function continuous on...Ch. 1.7 - In Exercises 1116, is the function continuous on...Ch. 1.7 - In Exercises 1116, is the function continuous on...Ch. 1.7 - In Exercises 1116, is the function continuous on...Ch. 1.7 - In Exercises 1116, is the function continuous on...Ch. 1.7 - Are the following functions continuous? Explain....Ch. 1.7 - Let f be the function given by...Ch. 1.7 - In Exercises 1922, show there is a number c, with...Ch. 1.7 - In Exercises 1922, show there is a number c, with...Ch. 1.7 - In Exercises 1922, show there is a number c, with...Ch. 1.7 - In Exercises 1922, show there is a number c, with...Ch. 1.7 - In Exercises 2328, use algebra to find the limit...Ch. 1.7 - In Exercises 2328, use algebra to find the limit...Ch. 1.7 - In Exercises 2328, use algebra to find the limit...Ch. 1.7 - In Exercises 2328, use algebra to find the limit...Ch. 1.7 - In Exercises 2328, use algebra to find the limit...Ch. 1.7 - In Exercises 2328, use algebra to find the limit...Ch. 1.7 - For Exercises 2930, find the value of the constant...Ch. 1.7 - For Exercises 2930, find the value of the constant...Ch. 1.7 - In Exercises 3134 find k so that the function is...Ch. 1.7 - In Exercises 3134 find k so that the function is...Ch. 1.7 - In Exercises 3134 find k so that the function is...Ch. 1.7 - In Exercises 3134 find k so that the function is...Ch. 1.7 - Which of the following are continuous functions of...Ch. 1.7 - An electrical circuit switches instantaneously...Ch. 1.7 - A stone dropped from the top of a cliff falls...Ch. 1.7 - Beginning at time t = 0, a car undergoing a crash...Ch. 1.7 - Discuss the continuity of the function g graphed...Ch. 1.7 - Is the following function continuous on [1, 1]?...Ch. 1.7 - Estimate the limits in Problems 4142 graphically....Ch. 1.7 - Estimate the limits in Problems 4142 graphically....Ch. 1.7 - In Problems 4348, use a graph to estimate the...Ch. 1.7 - In Problems 4348, use a graph to estimate the...Ch. 1.7 - In Problems 4348, use a graph to estimate the...Ch. 1.7 - In Problems 4348, use a graph to estimate the...Ch. 1.7 - In Problems 4348, use a graph to estimate the...Ch. 1.7 - In Problems 4348, use a graph to estimate the...Ch. 1.7 - In Problems 4954, find a value of k, if any,...Ch. 1.7 - In Problems 4954, find a value of k, if any,...Ch. 1.7 - In Problems 4954, find a value of k, if any,...Ch. 1.7 - In Problems 4954, find a value of k, if any,...Ch. 1.7 - In Problems 4954, find a value of k, if any,...Ch. 1.7 - In Problems 4954, find a value of k, if any,...Ch. 1.7 - (a) Use Figure 1.115 to decide at what points f(x)...Ch. 1.7 - For t in months, a population, in thousands, is...Ch. 1.7 - A 0.6ml dose of a drug is injected into a patient...Ch. 1.7 - In Problems 5861, at what values of x is the...Ch. 1.7 - In Problems 5861, at what values of x is the...Ch. 1.7 - In Problems 5861, at what values of x is the...Ch. 1.7 - In Problems 5861, at what values of x is the...Ch. 1.7 - In Problems 6265, is the function continuous for...Ch. 1.7 - In Problems 6265, is the function continuous for...Ch. 1.7 - In Problems 6265, is the function continuous for...Ch. 1.7 - In Problems 6265, is the function continuous for...Ch. 1.7 - Graph three different functions, continuous on 0 ...Ch. 1.7 - Let p(x) be a cubic polynomial with p(5) 0, p(10)...Ch. 1.7 - (a) What does a graph of y = ex and y = 4 x2 tell...Ch. 1.7 - (a) Does f(x) satisfy the conditions for the...Ch. 1.7 - Let g(x) be continuous with g(0) = 3, g(1) = 8,...Ch. 1.7 - By graphing y = (1 + x)1x, estimate limx0(1+x)1/x....Ch. 1.7 - Investigate limh0(1+h)1/h numerically.Ch. 1.7 - Let f(x) = sin(1x). (a) Find a sequence of...Ch. 1.7 - In Problems 7476, explain what is wrong with the...Ch. 1.7 - In Problems 7476, explain what is wrong with the...Ch. 1.7 - In Problems 7476, explain what is wrong with the...Ch. 1.7 - In Problems 7780, give an example of: A function...Ch. 1.7 - In Problems 7780, give an example of: A function...Ch. 1.7 - In Problems 7780, give an example of: A function...Ch. 1.7 - In Problems 7780, give an example of: A function...Ch. 1.7 - Are the statements in Problems 8183 true or false?...Ch. 1.7 - Are the statements in Problems 8183 true or false?...Ch. 1.7 - Are the statements in Problems 8183 true or false?...Ch. 1.8 - Use Figure 1.121 to find the limits or explain why...Ch. 1.8 - Use Figure 1.122 to estimate the following limits,...Ch. 1.8 - Use Figure 1.123 to find each of the following or...Ch. 1.8 - Use Figure 1.124 to find each of the following or...Ch. 1.8 - Use Figure 1.125 to estimate the following limits....Ch. 1.8 - In Exercises 68, calculate the limit using the...Ch. 1.8 - In Exercises 68, calculate the limit using the...Ch. 1.8 - In Exercises 68, calculate the limit using the...Ch. 1.8 - Using Figures 1.126 and 1.127, estimate...Ch. 1.8 - In Exercises 1015, draw a possible graph of f(x)....Ch. 1.8 - In Exercises 1015, draw a possible graph of f(x)....Ch. 1.8 - In Exercises 1015, draw a possible graph of f(x)....Ch. 1.8 - In Exercises 1015, draw a possible graph of f(x)....Ch. 1.8 - In Exercises 1015, draw a possible graph of f(x)....Ch. 1.8 - In Exercises 1015, draw a possible graph of f(x)....Ch. 1.8 - In Exercises 1628, find the limits using your...Ch. 1.8 - In Exercises 1628, find the limits using your...Ch. 1.8 - In Exercises 1628, find the limits using your...Ch. 1.8 - In Exercises 1628, find the limits using your...Ch. 1.8 - In Exercises 1628, find the limits using your...Ch. 1.8 - In Exercises 1628, find the limits using your...Ch. 1.8 - In Exercises 1628, find the limits using your...Ch. 1.8 - In Exercises 1628, find the limits using your...Ch. 1.8 - In Exercises 1628, find the limits using your...Ch. 1.8 - In Exercises 1628, find the limits using your...Ch. 1.8 - In Exercises 1628, find the limits using your...Ch. 1.8 - In Exercises 1628, find the limits using your...Ch. 1.8 - In Exercises 1628, find the limits using your...Ch. 1.8 - In Exercises 2934, give limxf(x)andlimx+f(x)....Ch. 1.8 - In Exercises 2934, give limxf(x)andlimx+f(x)....Ch. 1.8 - In Exercises 2934, give limxf(x)andlimx+f(x)....Ch. 1.8 - In Exercises 2934, give limxf(x)andlimx+f(x)....Ch. 1.8 - In Exercises 2934, give limxf(x)andlimx+f(x)....Ch. 1.8 - In Exercises 2934, give limxf(x)andlimx+f(x)....Ch. 1.8 - Does f(x)=|x|x have right or left limits at 0? Is...Ch. 1.8 - Exercises 3638, use algebra to evaluate...Ch. 1.8 - Exercises 3638, use algebra to evaluate...Ch. 1.8 - Exercises 3638, use algebra to evaluate...Ch. 1.8 - By graphing y=(1+1/x)x, estimate limx(1+1/x)x. You...Ch. 1.8 - Investigate limx(1+1/x)x numerically.Ch. 1.8 - (a) Sketch f(x)=e1/(x2+0.0001) around x = 0. (b)...Ch. 1.8 - What does a calculator suggest about limx0+xe1/x?...Ch. 1.8 - In Problems 4352, evaluate limx for the function....Ch. 1.8 - In Problems 4352, evaluate limx for the function....Ch. 1.8 - In Problems 4352, evaluate limx for the function....Ch. 1.8 - In Problems 4352, evaluate limx for the function....Ch. 1.8 - In Problems 4352, evaluate limx for the function....Ch. 1.8 - In Problems 4352, evaluate limx for the function....Ch. 1.8 - In Problems 4352, evaluate limx for the function....Ch. 1.8 - In Problems 4352, evaluate limx for the function....Ch. 1.8 - In Problems 4352, evaluate limx for the function....Ch. 1.8 - In Problems 4352, evaluate limx for the function....Ch. 1.8 - (a) Sketch the graph of a continuous function f...Ch. 1.8 - Sketch the graph of a function f with all of the...Ch. 1.8 - Sketch the graph of a function f with all of the...Ch. 1.8 - The graph of f(x) has a horizontal asymptote at y...Ch. 1.8 - A patient takes a 100 mg dose of a drug once daily...Ch. 1.8 - If p(x) is the function on page 58 giving the...Ch. 1.8 - Evaluate limx3x2+5xx+9 using the limit properties....Ch. 1.8 - Let limxf(x)=andlimxg(x)=. Give possible formulas...Ch. 1.8 - (a) Rewrite 1x510x225 in the form f(x)/g(x) for...Ch. 1.8 - In Problems 6263, modify the definition of limit...Ch. 1.8 - In Problems 6263, modify the definition of limit...Ch. 1.8 - Use Theorem 1.2 on page 71 to explain why if f and...Ch. 1.8 - In Problems 6566, explain what is wrong with the...Ch. 1.8 - In Problems 6566, explain what is wrong with the...Ch. 1.8 - In Problems 6768, give an example of: A rational...Ch. 1.8 - In Problems 6768, give an example of: A function...Ch. 1.8 - Suppose that limx3f(x)=7. Are the statements in...Ch. 1.8 - Suppose that limx3f(x)=7. Are the statements in...Ch. 1.8 - Suppose that limx3f(x)=7. Are the statements in...Ch. 1.8 - Suppose that limx3f(x)=7. Are the statements in...Ch. 1.8 - Suppose that limx3f(x)=7. Are the statements in...Ch. 1.8 - In Problems 7479, is the statement true or false?...Ch. 1.8 - In Problems 7479, is the statement true or false?...Ch. 1.8 - In Problems 7479, is the statement true or false?...Ch. 1.8 - In Problems 7479, is the statement true or false?...Ch. 1.8 - In Problems 7479, is the statement true or false?...Ch. 1.8 - In Problems 7479, is the statement true or false?...Ch. 1.8 - In Problems 8081, let f(x) = (1/x) sin(1/x). Is...Ch. 1.8 - In Problems 8081, let f(x) = (1/x) sin(1/x). Is...Ch. 1.9 - In Exercises 13, find the limit. limx03x2x2Ch. 1.9 - In Exercises 13, find the limit. limx03x2xCh. 1.9 - In Exercises 13, find the limit. limx03x2x4Ch. 1.9 - For Exercises 423, use algebra to simplify the...Ch. 1.9 - For Exercises 423, use algebra to simplify the...Ch. 1.9 - For Exercises 423, use algebra to simplify the...Ch. 1.9 - For Exercises 423, use algebra to simplify the...Ch. 1.9 - For Exercises 423, use algebra to simplify the...Ch. 1.9 - For Exercises 423, use algebra to simplify the...Ch. 1.9 - For Exercises 423, use algebra to simplify the...Ch. 1.9 - For Exercises 423, use algebra to simplify the...Ch. 1.9 - For Exercises 423, use algebra to simplify the...Ch. 1.9 - For Exercises 423, use algebra to simplify the...Ch. 1.9 - For Exercises 423, use algebra to simplify the...Ch. 1.9 - For Exercises 423, use algebra to simplify the...Ch. 1.9 - For Exercises 423, use algebra to simplify the...Ch. 1.9 - For Exercises 423, use algebra to simplify the...Ch. 1.9 - For Exercises 423, use algebra to simplify the...Ch. 1.9 - For Exercises 423, use algebra to simplify the...Ch. 1.9 - For Exercises 423, use algebra to simplify the...Ch. 1.9 - For Exercises 423, use algebra to simplify the...Ch. 1.9 - For Exercises 423, use algebra to simplify the...Ch. 1.9 - For Exercises 423, use algebra to simplify the...Ch. 1.9 - In Exercises 2426, for the given constant c and...Ch. 1.9 - In Exercises 2426, for the given constant c and...Ch. 1.9 - In Exercises 2426, for the given constant c and...Ch. 1.9 - In Exercises 2734, use algebra to evaluate the...Ch. 1.9 - In Exercises 2734, use algebra to evaluate the...Ch. 1.9 - In Exercises 2734, use algebra to evaluate the...Ch. 1.9 - In Exercises 2734, use algebra to evaluate the...Ch. 1.9 - In Exercises 2734, use algebra to evaluate the...Ch. 1.9 - In Exercises 2734, use algebra to evaluate the...Ch. 1.9 - In Exercises 2734, use algebra to evaluate the...Ch. 1.9 - In Exercises 2734, use algebra to evaluate the...Ch. 1.9 - Find limx1f(x) if, for all x, 4x + 6 f(x) x2 2x...Ch. 1.9 - Find limx0f(x) if, for all x, 4 cos(2x) f(x) 3x2...Ch. 1.9 - Find limxf(x) if, for x 0, 4x25x2f(x)4x6+3x6Ch. 1.9 - In Problems 3849, find all values for the constant...Ch. 1.9 - In Problems 3849, find all values for the constant...Ch. 1.9 - In Problems 3849, find all values for the constant...Ch. 1.9 - In Problems 3849, find all values for the constant...Ch. 1.9 - In Problems 3849, find all values for the constant...Ch. 1.9 - In Problems 3849, find all values for the constant...Ch. 1.9 - In Problems 3849, find all values for the constant...Ch. 1.9 - In Problems 3849, find all values for the constant...Ch. 1.9 - In Problems 3849, find all values for the constant...Ch. 1.9 - In Problems 3849, find all values for the constant...Ch. 1.9 - In Problems 3849, find all values for the constant...Ch. 1.9 - In Problems 3849, find all values for the constant...Ch. 1.9 - In Problems 5055, use the indicated new variable...Ch. 1.9 - In Problems 5055, use the indicated new variable...Ch. 1.9 - In Problems 5055, use the indicated new variable...Ch. 1.9 - In Problems 5055, use the indicated new variable...Ch. 1.9 - In Problems 5055, use the indicated new variable...Ch. 1.9 - In Problems 5055, use the indicated new variable...Ch. 1.9 - Use the Squeeze Theorem to prove limxsinxx=0.Ch. 1.9 - Use the Squeeze Theorem to prove limx1x+ex=0.Ch. 1.9 - In Problems 5861, use the Squeeze Theorem to...Ch. 1.9 - In Problems 5861, use the Squeeze Theorem to...Ch. 1.9 - In Problems 5861, use the Squeeze Theorem to...Ch. 1.9 - In Problems 5861, use the Squeeze Theorem to...Ch. 1.9 - Let limxf(x)=0 and limxg(x)=0. Give possible...Ch. 1.9 - In Problems 6366, for the given constant c and...Ch. 1.9 - In Problems 6366, for the given constant c and...Ch. 1.9 - In Problems 6366, for the given constant c and...Ch. 1.9 - In Problems 6366, for the given constant c and...Ch. 1.9 - In Problems 6772, for the given m and n, evaluate...Ch. 1.9 - In Problems 6772, for the given m and n, evaluate...Ch. 1.9 - In Problems 6772, for the given m and n, evaluate...Ch. 1.9 - In Problems 6772, for the given m and n, evaluate...Ch. 1.9 - In Problems 6772, for the given m and n, evaluate...Ch. 1.9 - In Problems 6772, for the given m and n, evaluate...Ch. 1.9 - For any f(x), where 1xf(x)1x, find values of c,...Ch. 1.9 - In Problems 7475, explain what is wrong with the...Ch. 1.9 - In Problems 7475, explain what is wrong with the...Ch. 1.9 - Are the statements in Problems 7683 true or false?...Ch. 1.9 - Are the statements in Problems 7683 true or false?...Ch. 1.9 - Are the statements in Problems 7683 true or false?...Ch. 1.9 - Are the statements in Problems 7683 true or false?...Ch. 1.9 - Are the statements in Problems 7683 true or false?...Ch. 1.9 - Are the statements in Problems 7683 true or false?...Ch. 1.9 - Are the statements in Problems 7683 true or false?...Ch. 1.9 - Are the statements in Problems 7683 true or false?...Ch. 1.10 - Figure 1.5 shows f(x) and the region |f(x) L| e....Ch. 1.10 - Figure 1.6 shows g(x) and the region |g(x) L| ....Ch. 1.10 - In Exercises 34, for each value of , find a...Ch. 1.10 - In Exercises 34, for each value of , find a...Ch. 1.10 - In Exercises 58, for the given limit limxcf(x)=L,...Ch. 1.10 - In Exercises 58, for the given limit limxcf(x)=L,...Ch. 1.10 - In Exercises 58, for the given limit limxcf(x)=L,...Ch. 1.10 - In Exercises 58, for the given limit limxcf(x)=L,...Ch. 1.10 - Write the definition of the following statement...Ch. 1.10 - In Problems 1011, for each value of , find a...Ch. 1.10 - In Problems 1011, for each value of , find a...Ch. 1.10 - In Problems 1216, for the given limit limxcf(x)=L,...Ch. 1.10 - In Problems 1216, for the given limit limxcf(x)=L,...Ch. 1.10 - In Problems 1216, for the given limit limxcf(x)=L,...Ch. 1.10 - In Problems 1216, for the given limit limxcf(x)=L,...Ch. 1.10 - In Problems 1216, for the given limit limxcf(x)=L,...Ch. 1.10 - In Problems 1718, for the given function do the...Ch. 1.10 - In Problems 1718, for the given function do the...Ch. 1.10 - For Problems 1925, use the definition of limit to...Ch. 1.10 - For Problems 1925, use the definition of limit to...Ch. 1.10 - For Problems 1925, use the definition of limit to...Ch. 1.10 - For Problems 1925, use the definition of limit to...Ch. 1.10 - For Problems 1925, use the definition of limit to...Ch. 1.10 - For Problems 1925, use the definition of limit to...Ch. 1.10 - For Problems 1925, use the definition of limit to...Ch. 1.10 - Let f(x) = sin(l/x) (see Figure 1.7). Show that...Ch. 1.10 - Show that the following functions are both...Ch. 1.10 - In Problems 2830, modify the definition of limit...Ch. 1.10 - In Problems 2830, modify the definition of limit...Ch. 1.10 - In Problems 2830, modify the definition of limit...Ch. 1.10 - This problem suggests a proof of the first...Ch. 1.10 - Prove the second property of limits:...Ch. 1.10 - This problem suggests a proof of the third...Ch. 1.10 - Suppose that limx3f(x)=7. Are the statements in...Ch. 1.10 - Suppose that limx3f(x)=7. Are the statements in...Ch. 1.10 - Which of the statements in Problems 36-40 are true...Ch. 1.10 - Which of the statements in Problems 36-40 are true...Ch. 1.10 - Which of the statements in Problems 36-40 are true...Ch. 1.10 - Which of the statements in Problems 36-40 are true...Ch. 1.10 - Which of the statements in Problems 36-40 are true...Ch. 1 - Find formulas for the functions described in...Ch. 1 - Find formulas for the functions described in...Ch. 1 - Find formulas for the functions described in...Ch. 1 - Find formulas for the functions described in...Ch. 1 - Find formulas for the functions described in...Ch. 1 - Find formulas for the functions described in...Ch. 1 - Find formulas for the functions described in...Ch. 1 - Find formulas for the functions described in...Ch. 1 - Find derivatives for the functions in Exercises...Ch. 1 - If g(x) = (4 x2)/(x2 + x), find the domain of...Ch. 1 - The entire graph of f(x) is shown in Figure 1.1....Ch. 1 - For f(n) = 3n2 2 and g(n) = n +1, find and...Ch. 1 - Let m = f(A) be the minimum annual gross income,...Ch. 1 - For Exercises 1417, solve for t using logs. 5t = 7Ch. 1 - For Exercises 1417, solve for t using logs. 2 =...Ch. 1 - For Exercises 1417, solve for t using logs. 7 3t...Ch. 1 - For Exercises 1417, solve for t using logs....Ch. 1 - In Exercises 1819, put the functions in the form P...Ch. 1 - In Exercises 1819, put the functions in the form P...Ch. 1 - For Exercises 2021, find functions f and g such...Ch. 1 - For Exercises 2021, find functions f and g such...Ch. 1 - Find the amplitudes and periods in Exercises 2223....Ch. 1 - Find the amplitudes and periods in Exercises 2223....Ch. 1 - Consider the function y = 5 + cos(3x). (a) What is...Ch. 1 - Determine the end behavior of each function as x ...Ch. 1 - In Exercises 2627, which function dominates as x ...Ch. 1 - In Exercises 2627, which function dominates as x ...Ch. 1 - Find possible formulas for the graphs in Exercises...Ch. 1 - Find possible formulas for the graphs in Exercises...Ch. 1 - Find possible formulas for the graphs in Exercises...Ch. 1 - Find possible formulas for the graphs in Exercises...Ch. 1 - Find possible formulas for the graphs in Exercises...Ch. 1 - Find possible formulas for the graphs in Exercises...Ch. 1 - Find possible formulas for the graphs in Exercises...Ch. 1 - Find possible formulas for the graphs in Exercises...Ch. 1 - Find possible formulas for the graphs in Exercises...Ch. 1 - Find possible formulas for the graphs in Exercises...Ch. 1 - Find possible formulas for the graphs in Exercises...Ch. 1 - Find possible formulas for the graphs in Exercises...Ch. 1 - Find possible formulas for the graphs in Exercises...Ch. 1 - Find possible formulas for the graphs in Exercises...Ch. 1 - Are the functions in Exercises 4243 continuous on...Ch. 1 - Are the functions in Exercises 4243 continuous on...Ch. 1 - Use Figure 1.2 to estimate the limits if they...Ch. 1 - For the functions in Exercises 4546, use algebra...Ch. 1 - For the functions in Exercises 4546, use algebra...Ch. 1 - Use the graph of g(t) in Figure 1.3 to give...Ch. 1 - Use Figure 1.4 to give approximate values for the...Ch. 1 - In Exercises 4952, is the function continuous on...Ch. 1 - In Exercises 4952, is the function continuous on...Ch. 1 - In Exercises 4952, is the function continuous on...Ch. 1 - In Exercises 4952, is the function continuous on...Ch. 1 - Use a graph to estimate each of the limits in...Ch. 1 - Use a graph to estimate each of the limits in...Ch. 1 - Use a graph to estimate each of the limits in...Ch. 1 - Use a graph to estimate each of the limits in...Ch. 1 - In Exercises 5758, (a) Make a table of values of...Ch. 1 - In Exercises 5758, (a) Make a table of values of...Ch. 1 - For Exercises 5961, use the end behavior of the...Ch. 1 - For Exercises 5961, use the end behavior of the...Ch. 1 - For Exercises 5961, use the end behavior of the...Ch. 1 - For Exercises 6263, create a function, f(x), such...Ch. 1 - For Exercises 6263, create a function, f(x), such...Ch. 1 - Evaluate the limits of the following function, or...Ch. 1 - Evaluate the limits of the following function, or...Ch. 1 - Evaluate the limits of the following function, or...Ch. 1 - In Exercises 6772, use algebra to find the limit...Ch. 1 - In Exercises 6772, use algebra to find the limit...Ch. 1 - In Exercises 6772, use algebra to find the limit...Ch. 1 - In Exercises 6772, use algebra to find the limit...Ch. 1 - In Exercises 6772, use algebra to find the limit...Ch. 1 - In Exercises 6772, use algebra to find the limit...Ch. 1 - The yield, Y, of an apple orchard (in bushels) as...Ch. 1 - The graph of Fahrenheit temperature, F, as a...Ch. 1 - The demand function for a certain product, q =...Ch. 1 - A flight from Dulles Airport in Washington, DC, to...Ch. 1 - The force, F, between two atoms depends on the...Ch. 1 - When the Olympic Games were held outside Mexico...Ch. 1 - The population of the Ukraine fell from 46.01...Ch. 1 - During April 2006, Zimbabwes inflation rate...Ch. 1 - A kilogram weighs about 2.2 pounds. (a) Write a...Ch. 1 - The graph of f(x) is a parabola that opens upward...Ch. 1 - Each of the functions in the table is increasing...Ch. 1 - A culture of 100 bacteria doubles after 2 hours....Ch. 1 - If f(x) = a ln(x + 2), how does increasing a...Ch. 1 - What is the doubling time of prices which are...Ch. 1 - Find the half-life of a radioactive substance that...Ch. 1 - The air in a factory is being filtered so that the...Ch. 1 - The half-life of radioactive strontium-90 is 29...Ch. 1 - What is the period of the motion of the minute...Ch. 1 - In an electrical outlet, the voltage, V, in volts,...Ch. 1 - In a US household, the voltage in volts in an...Ch. 1 - (a) How does the parameter A affect the graph of y...Ch. 1 - Water is flowing down a cylindrical pipe of radius...Ch. 1 - Values of three functions are given in Table 1.1,...Ch. 1 - Figure 1.8 shows the hat function...Ch. 1 - The point P moves around the circle of radius 5...Ch. 1 - Match the following functions with the graphs in...Ch. 1 - Use a computer or calculator to sketch the...Ch. 1 - If possible, choose k so that the following...Ch. 1 - Find k so that the following function is...Ch. 1 - A car is coasting down a hill at a constant speed....Ch. 1 - By graphing y = 3 2et estimate the limit...Ch. 1 - Evaluate the limits of the following function, or...Ch. 1 - (a) For k = 1, sketch f(x)={kx0x2(x2)2+32x4. (b)...Ch. 1 - (a) Graph a continuous function g with all the...Ch. 1 - In Problems 108111, let g(t) be a function whose...Ch. 1 - In Problems 108111, let g(t) be a function whose...Ch. 1 - In Problems 108111, let g(t) be a function whose...Ch. 1 - In Problems 108111, let g(t) be a function whose...Ch. 1 - In Problems 112113, use the given value of f(5)...Ch. 1 - In Problems 112113, use the given value of f(5)...Ch. 1 - In Problems 114116, find the limits....Ch. 1 - In Problems 114116, find the limits. limh0x+hxhCh. 1 - In Problems 114116, find the limits....Ch. 1 - For Problems 117120, if possible, calculate the...Ch. 1 - For Problems 117120, if possible, calculate the...Ch. 1 - For Problems 117120, if possible, calculate the...Ch. 1 - For problems 117-120, if possible, calculate the...Ch. 1 - For Problems 121124, evaluate the limit, using the...Ch. 1 - For Problems 121124, evaluate the limit, using the...Ch. 1 - For Problems 121124, evaluate the limit, using the...Ch. 1 - For Problems 121124, evaluate the limit, using the...Ch. 1 - The notation limx0+ means that we only consider...Ch. 1 - Let limxf(x)= and limxg(x)=. Give possible...Ch. 1 - (a) Evaluate the limit limx0(x1x). (b) Explain why...Ch. 1 - For the functions in Problems 128135, do the...Ch. 1 - For the functions in Problems 128135, do the...Ch. 1 - For the functions in Problems 128135, do the...Ch. 1 - For the functions in Problems 128135, do the...Ch. 1 - For the functions in Problems 128135, do the...Ch. 1 - For the functions in Problems 128135, do the...Ch. 1 - For the functions in Problems 128135, do the...Ch. 1 - For the functions in Problems 128135, do the...
Additional Math Textbook Solutions
Find more solutions based on key concepts
Hypothesis Testing Using a P-Value In Exercises 31–36,
identify the claim and state H0 and Ha.
find the standar...
Elementary Statistics: Picturing the World (7th Edition)
Solve each formula for the given letter . [2.3] What percent of 60 is 42? [2.4]
Elementary and Intermediate Algebra: Concepts and Applications (7th Edition)
Alternating Series Test Determine whether the following series converge. 13. k=1(1)kk3k+2
Calculus: Early Transcendentals (2nd Edition)
Finding Bone Density Scores. In Exercises 37–40 assume that a randomly selected subject is given a bone density...
Elementary Statistics (13th Edition)
In Exercises 5–12, find and sketch the domain for each function.
11.
University Calculus: Early Transcendentals (4th Edition)
1. combination of numbers, variables, and operation symbols is called an algebraic______.
Algebra and Trigonometry (6th Edition)
Knowledge Booster


Learn more about
Need a deep-dive on the concept behind this application? Look no further. Learn more about this topic, calculus and related others by exploring similar questions and additional content below.Similar questions
- ۳/۱ R₂ = X2 2) slots per pole per phase 3/31 B. 180 msl Kas Sin (I) 1sin() sin(30) Sin (30) اذا ميريد شرح الكتب بس 0 بالفراغ 3) Cos (30): 0.866 4) Rotating 5) Synchronous speeds 120×50 looo G 1000-950 1000 Copper losses 5kw Rotor input 5 loo kw 0.05 6) 1 اذا ميريد شرح الكتب فقط look 7) rotor DC ined sove in peaper I need a detailed solution on paper please 0 64 Find the general solution of the following equations: QI//y(4)-16y= 0. Find the general solution of the following equations: Q2ll yll-4y/ +13y=esinx.arrow_forwardR₂ = X2 2) slots per pole per phase = 3/31 B-180 60 msl kd Kas Sin () 2 I sin (6) sin(30) Sin (30) اذا مريد شرح الكتب بس 0 بالفراغ 3 Cos (30) 0.866 4) Rotating ined sove in peaper 5) Synchronous speed s 120×50 6 s = 1000-950 1000 Copper losses 5kw Rotor input 5 0.05 6) 1 loo kw اذا ميريد شرح الكتب فقط Look 7) rotov DC I need a detailed solution on paper please 0 64 Solve the following equations: 0 Q1// Find the solution of: ( y • with y(0) = 1. dx x²+y²arrow_forwardR₂ = X2 2) slots per pole per phase = 3/3 1 B-180-60 msl Ka Sin (1) Isin () sin(30) Sin (30) اذا ميريد شرح الكتب بس 0 بالفراغ 3) Cos (30) 0.866 4) Rotating 5) Synchronous speed, 120 x 50 s = 1000-950 1000 Copper losses 5kw Rotor input 5 6) 1 0.05 G 50105 loo kw اذا ميريد شرح الكتب فقط look 7) rotov DC ined sove in peaper I need a detailed solution on paper please 064 2- A hot ball (D=15 cm ) is cooled by forced air T.-30°C, the rate of heat transfer from the ball is 460.86 W. Take for the air -0.025 Wim °C and Nu=144.89, find the ball surface temperature a) 300 °C 16 b) 327 °C c) 376 °C d) None か = 750 01arrow_forward
- Don't do 14. Please solve 19arrow_forwardPlease solve 14 and 15arrow_forward1. Consider the following system of equations: x13x2 + 4x3 - 5x4 = 7 -2x13x2 + x3 - 6x4 = 7 x16x213x3 - 21x4 = 28 a) Solve the system. Write your solution in parametric and vector form. b) What is a geometric description of the solution. 7 c) Is v = 7 in the span of the set S= [28. 1 HE 3 -5 3 ·6 ? If it is, write v 6 as a linear combination of the vectors in S. Justify. d) How many solutions are there to the associated homogeneous system for the system above? Justify. e) Let A be the coefficient matrix from the system above. Find the set of all solutions to Ax = 0. f) Is there a solution to Ax=b for all b in R³? Justify.arrow_forward
- 4. Suppose that A is made up of 5 column vectors in R³, and suppose that the rank(A)=3. a. How many solutions are there to Ax=0? Justify. b. What is a geometric description for the nullspace(A)? Justify. c. Do the column vectors of A span R³? Justify. d. Is A invertible? Justify.arrow_forward3. Suppose that A is 5 x 5 and rank(A)=4. Use this information to answer the following. a. Give a geometric description of nullspace(A). Justify. b. Is A invertible? Justify. c. Give a geometric description of the span of the column vectors of A. What space are the column vectors of A in? Justify. d. What is determinant of A? Justify.arrow_forward2. Consider the matrix: A || 1 1 -3 14 2 1 01 4 1 2 2 -26 1 -3 1 5] a) What is rank(A)? b) Is A invertible? Justify. c) Find the nullspace(A). Justify. d) Is the trivial solution the only solution to Ax=0? Justify. e) What is the span of the column vectors of A? Justify.arrow_forward
- E 5. Suppose that S={v € R²: v = [2x² - 3]}. Is S a subspace of R²? Prove or disprovearrow_forward6. Suppose that V1, V2 ER", show that span{v1, v2} is a subspace of Rn.arrow_forwardRa X 2) slots per pole per phase 3/31 180 Ko Sin (1) Kdl 1 sin (4) sin(3) Sin (30) اذا مرید شرح الكتب بس 0 بالفراغ 3) Cos (30) 0.866 4) Rotating 5) Synchronous speed, 120 Fo lasa! G s.1000-950 20:05 1000 Capper losses: 5kw Rotor input lookw 0.05 ined sove in peaper I need a detailed solution on paper please 6) 1 ۳/۱ وه اذا ميريد شرح الكتب فقط look DC 7) rotov Find the general solution of the following equations: +4y=tan2x 3 7357 Find the general solution of the following equations: - Qll y + y (³) = 0. 101arrow_forward
arrow_back_ios
SEE MORE QUESTIONS
arrow_forward_ios
Recommended textbooks for you
 Algebra and Trigonometry (MindTap Course List)AlgebraISBN:9781305071742Author:James Stewart, Lothar Redlin, Saleem WatsonPublisher:Cengage Learning
 Algebra for College StudentsAlgebraISBN:9781285195780Author:Jerome E. Kaufmann, Karen L. SchwittersPublisher:Cengage Learning
 Glencoe Algebra 1, Student Edition, 9780079039897...AlgebraISBN:9780079039897Author:CarterPublisher:McGraw Hill
 College Algebra (MindTap Course List)AlgebraISBN:9781305652231Author:R. David Gustafson, Jeff HughesPublisher:Cengage Learning
 Algebra & Trigonometry with Analytic GeometryAlgebraISBN:9781133382119Author:SwokowskiPublisher:Cengage
Algebra and Trigonometry (MindTap Course List)
Algebra
ISBN:9781305071742
Author:James Stewart, Lothar Redlin, Saleem Watson
Publisher:Cengage Learning
Algebra for College Students
Algebra
ISBN:9781285195780
Author:Jerome E. Kaufmann, Karen L. Schwitters
Publisher:Cengage Learning
Glencoe Algebra 1, Student Edition, 9780079039897...
Algebra
ISBN:9780079039897
Author:Carter
Publisher:McGraw Hill
College Algebra (MindTap Course List)
Algebra
ISBN:9781305652231
Author:R. David Gustafson, Jeff Hughes
Publisher:Cengage Learning
Algebra & Trigonometry with Analytic Geometry
Algebra
ISBN:9781133382119
Author:Swokowski
Publisher:Cengage
Use of ALGEBRA in REAL LIFE; Author: Fast and Easy Maths !;https://www.youtube.com/watch?v=9_PbWFpvkDc;License: Standard YouTube License, CC-BY
Compound Interest Formula Explained, Investment, Monthly & Continuously, Word Problems, Algebra; Author: The Organic Chemistry Tutor;https://www.youtube.com/watch?v=P182Abv3fOk;License: Standard YouTube License, CC-BY
Applications of Algebra (Digit, Age, Work, Clock, Mixture and Rate Problems); Author: EngineerProf PH;https://www.youtube.com/watch?v=Y8aJ_wYCS2g;License: Standard YouTube License, CC-BY