
Calculus: Single And Multivariable
7th Edition
ISBN: 9781119444190
Author: Hughes-Hallett, Deborah; Mccallum, William G.; Gleason, Andrew M.; Connally, Eric; Kalaycioglu, Selin; Flath, Daniel E.; Lahme, Brigitte; Lomen, David O.; Lock, Patti Frazer; Lovelock, David; Morris, Jerry; Lozano, Guadalupe I.; Mumford, David; Quinney, D
Publisher: WILEY
expand_more
expand_more
format_list_bulleted
Concept explainers
Videos
Textbook Question
Chapter 1.1, Problem 71E
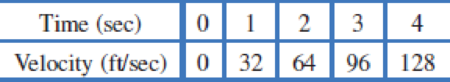
When Galileo was formulating the laws of motion, he considered the motion of a body starting from rest and falling under gravity. He originally thought that the velocity of such a falling body was proportional to the distance it had fallen. What do the experimental data in Table 1.6 tell you about Galileo’s hypothesis? What alternative hypothesis is suggested by the two sets of data in Table 1.6 and Table 1.7?
Table 1.6
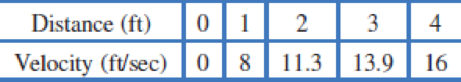
Table 1.7
Expert Solution & Answer
Want to see the full answer?
Check out a sample textbook solution
Students have asked these similar questions
An airplane flies due west at an airspeed of 428 mph. The wind blows in the direction of 41° south of west
at 50 mph. What is the ground speed of the airplane? What is the bearing of the airplane?
428 mph
41°
50 mph
a. The ground speed of the airplane is
b. The bearing of the airplane is
mph.
south of west.
Rylee's car is stuck in the mud. Roman and Shanice come along in a truck to help pull her out. They attach
one end of a tow strap to the front of the car and the other end to the truck's trailer hitch, and the truck
starts to pull. Meanwhile, Roman and Shanice get behind the car and push. The truck generates a
horizontal force of 377 lb on the car. Roman and Shanice are pushing at a slight upward angle and generate
a force of 119 lb on the car. These forces can be represented by vectors, as shown in the figure below. The
angle between these vectors is 20.2°. Find the resultant force (the vector sum), then give its magnitude
and its direction angle from the positive x-axis.
119 lb
20.2°
377 lb
a. The resultant force is
(Tip: omit degree notations from your answers; e.g. enter cos(45) instead of cos(45°))
b. It's magnitude is
lb.
c. It's angle from the positive x-axis is
Find a plane containing the point (3, -3, 1) and the line of intersection of the planes 2x + 3y - 3z = 14
and -3x - y + z = −21.
The equation of the plane is:
Chapter 1 Solutions
Calculus: Single And Multivariable
Ch. 1.1 - The population of a city, P, in millions, is a...Ch. 1.1 - The pollutant PCB (polychlorinated biphenyl) can...Ch. 1.1 - Describe what Figure 1.8 tells you about an...Ch. 1.1 - For Exercises 47, find an equation for the line...Ch. 1.1 - For Exercises 47, find an equation for the line...Ch. 1.1 - For Exercises 47, find an equation for the line...Ch. 1.1 - For Exercises 47, find an equation for the line...Ch. 1.1 - For Exercises 811, determine the slope and the...Ch. 1.1 - For Exercises 811, determine the slope and the...Ch. 1.1 - For Exercises 811, determine the slope and the...
Ch. 1.1 - For Exercises 811, determine the slope and the...Ch. 1.1 - Match the graphs in Figure 1.9 with the following...Ch. 1.1 - Match the graphs in Figure 1.10 with the following...Ch. 1.1 - Estimate the slope and the equation of the line in...Ch. 1.1 - Find an equation for the line with slope m through...Ch. 1.1 - Find a linear function that generates the values...Ch. 1.1 - For Exercises 1719, use the facts that parallel...Ch. 1.1 - For Exercises 1719, use the facts that parallel...Ch. 1.1 - For Exercises 1719, use the facts that parallel...Ch. 1.1 - For Exercises 2023, give the approximate domain...Ch. 1.1 - For Exercises 2023, give the approximate domain...Ch. 1.1 - For Exercises 2023, give the approximate domain...Ch. 1.1 - For Exercises 2023, give the approximate domain...Ch. 1.1 - Prob. 24ECh. 1.1 - Prob. 25ECh. 1.1 - If f(t)=t216, find all values of t for which f(t)...Ch. 1.1 - In Exercises 2731, write a formula representing...Ch. 1.1 - In Exercises 2731, write a formula representing...Ch. 1.1 - In Exercises 2731, write a formula representing...Ch. 1.1 - In Exercises 2731, write a formula representing...Ch. 1.1 - In Exercises 2731, write a formula representing...Ch. 1.1 - In December 2010, the snowfall in Minneapolis was...Ch. 1.1 - The value of a car, V = f(a), in thousands of...Ch. 1.1 - Which graph in Figure 1.13 best matches each of...Ch. 1.1 - In Problems 3538 the function S = f(t) gives the...Ch. 1.1 - In Problems 3538 the function S = f(t) gives the...Ch. 1.1 - In Problems 3538 the function S = f(t) gives the...Ch. 1.1 - In Problems 3538 the function S = f(t) gives the...Ch. 1.1 - Problems 3942 ask you to plot graphs based on the...Ch. 1.1 - Problems 3942 ask you to plot graphs based on the...Ch. 1.1 - Problems 3942 ask you to plot graphs based on the...Ch. 1.1 - Problems 3942 ask you to plot graphs based on the...Ch. 1.1 - An object is put outside on a cold day at time t =...Ch. 1.1 - A rock is dropped from a window and falls to the...Ch. 1.1 - You drive at a constant speed from Chicago to...Ch. 1.1 - US imports of crude oil and petroleum have been...Ch. 1.1 - Problems 4749 use Figure 1.16 showing how the...Ch. 1.1 - Problems 4749 use Figure 1.16 showing how the...Ch. 1.1 - Problems 4749 use Figure 1.16 showing how the...Ch. 1.1 - Marmots are large squirrels that hibernate in the...Ch. 1.1 - In Colorado spring has arrived when the bluebell...Ch. 1.1 - On March 5, 2015, Capracotta, Italy, received 256...Ch. 1.1 - In a California town, the monthly charge for waste...Ch. 1.1 - For tax purposes, you may have to report the value...Ch. 1.1 - Residents of the town of Maple Grove who are...Ch. 1.1 - A controversial 1992 Danish study10 reported that...Ch. 1.1 - Let f(t) be the number of US billionaires in year...Ch. 1.1 - The cost of planting seed is usually a function of...Ch. 1.1 - An airplane uses a fixed amount of fuel for take...Ch. 1.1 - For the line y = f(x) in Figure 1.19, evaluate (a)...Ch. 1.1 - For the line y = g(x) in Figure 1.20, evaluate (a)...Ch. 1.1 - An alternative to petroleum-based diesel fuel,...Ch. 1.1 - Hydroelectric power is electric power generated by...Ch. 1.1 - Solar panels are arrays of photovoltaic cells that...Ch. 1.1 - Table 1.4 shows the average annual sea level, S,...Ch. 1.1 - The table gives the required standard weight, w,...Ch. 1.1 - A company rents cars at 40 a day and 15 cents a...Ch. 1.1 - A 25,000 vehicle depreciates 2000 a year as it...Ch. 1.1 - A bakery owner knows that customers buy a total of...Ch. 1.1 - (a) Consider the functions graphed in Figure...Ch. 1.1 - When Galileo was formulating the laws of motion,...Ch. 1.1 - In Problems 7276, explain what is wrong with the...Ch. 1.1 - In Problems 7276, explain what is wrong with the...Ch. 1.1 - In Problems 7276, explain what is wrong with the...Ch. 1.1 - In Problems 7276, explain what is wrong with the...Ch. 1.1 - In Problems 7276, explain what is wrong with the...Ch. 1.1 - In Problems 7778, give an example of: A linear...Ch. 1.1 - In Problems 7778, give an example of: A formula...Ch. 1.1 - Are the statements in Problems 7984 true or false?...Ch. 1.1 - Are the statements in Problems 7984 true or false?...Ch. 1.1 - Are the statements in Problems 7984 true or false?...Ch. 1.1 - Are the statements in Problems 7984 true or false?...Ch. 1.1 - Are the statements in Problems 7984 true or false?...Ch. 1.1 - Are the statements in Problems 7984 true or false?...Ch. 1.1 - Which of the following functions has its domain...Ch. 1.2 - In Exercises 14, decide whether the graph is...Ch. 1.2 - In Exercises 14, decide whether the graph is...Ch. 1.2 - In Exercises 14, decide whether the graph is...Ch. 1.2 - In Exercises 14, decide whether the graph is...Ch. 1.2 - The functions in Exercises 58 represent...Ch. 1.2 - The functions in Exercises 58 represent...Ch. 1.2 - The functions in Exercises 58 represent...Ch. 1.2 - The functions in Exercises 58 represent...Ch. 1.2 - Write the functions in Exercises 912 in the form P...Ch. 1.2 - Write the functions in Exercises 912 in the form P...Ch. 1.2 - Write the functions in Exercises 912 in the form P...Ch. 1.2 - Write the functions in Exercises 912 in the form P...Ch. 1.2 - In Exercises 1314, let f(t) = Q0at = Q0(1 + r)t....Ch. 1.2 - In Exercises 1314, let f(t) = Q0at = Q0(1 + r)t....Ch. 1.2 - A town has a population of 1000 people at time t =...Ch. 1.2 - An air-freshener starts with 30 grams and...Ch. 1.2 - For which pairs of consecutive points in Figure...Ch. 1.2 - The table gives the average temperature in...Ch. 1.2 - (a) Which (if any) of the functions in the...Ch. 1.2 - In Problems 2021, find all the tables that have...Ch. 1.2 - In Problems 2021, find all the tables that have...Ch. 1.2 - Table 1.10 shows some values of a linear function...Ch. 1.2 - Match the functions (s), f(s), and g(s), whose...Ch. 1.2 - Each of the functions g, h, k in Table 1.12 is...Ch. 1.2 - Each of the functions in Table 1.13 decreases, but...Ch. 1.2 - Figure 1.36 shows Q = 50(1.2)t, Q = 50(0.6)t , Q =...Ch. 1.2 - In Problems 2732, give a possible formula for the...Ch. 1.2 - In Problems 2732, give a possible formula for the...Ch. 1.2 - In Problems 2732, give a possible formula for the...Ch. 1.2 - In Problems 2732, give a possible formula for the...Ch. 1.2 - In Problems 2732, give a possible formula for the...Ch. 1.2 - In Problems 2732, give a possible formula for the...Ch. 1.2 - The table gives the number of North American...Ch. 1.2 - When a new product is advertised, more and more...Ch. 1.2 - Sketch reasonable graphs for the following. Pay...Ch. 1.2 - (a) A population, P, grows at a continuous rate of...Ch. 1.2 - A 2008 study of 300 oil fields producing a total...Ch. 1.2 - In 2014, the worlds population reached 7.17...Ch. 1.2 - Aircraft require longer takeoff distances, called...Ch. 1.2 - One of the main contaminants of a nuclear...Ch. 1.2 - A certain region has a population of 10,000,000...Ch. 1.2 - According to the EPA, sales of electronic devices...Ch. 1.2 - (a) Estimate graphically the doubling time of the...Ch. 1.2 - A deposit of P0 into a bank account has a doubling...Ch. 1.2 - A 325 mg aspirin has a half-life of H hours in a...Ch. 1.2 - (a) The half-life of radium-226 is 1620 years. If...Ch. 1.2 - In the early 1960s, radioactive strontium-90 was...Ch. 1.2 - Food bank usage in Britain has grown dramatically...Ch. 1.2 - Problems 5051 concern biodiesel, a fuel derived...Ch. 1.2 - Problems 5051 concern biodiesel, a fuel derived...Ch. 1.2 - Hydroelectric power is electric power generated by...Ch. 1.2 - Problems 5354 concern wind power, which has been...Ch. 1.2 - Problems 5354 concern wind power, which has been...Ch. 1.2 - (a) The exponential functions in Figure 1.39 have...Ch. 1.2 - In Problems 5659, explain what is wrong with the...Ch. 1.2 - In Problems 5659, explain what is wrong with the...Ch. 1.2 - In Problems 5659, explain what is wrong with the...Ch. 1.2 - In Problems 5659, explain what is wrong with the...Ch. 1.2 - In Problems 6064, give an example of: A decreasing...Ch. 1.2 - In Problems 6064, give an example of: A formula...Ch. 1.2 - In Problems 6064, give an example of: A function...Ch. 1.2 - In Problems 6064, give an example of: A function...Ch. 1.2 - In Problems 6064, give an example of: An...Ch. 1.2 - Are the statements in Problems 6572 true or false?...Ch. 1.2 - Are the statements in Problems 6572 true or false?...Ch. 1.2 - Are the statements in Problems 6572 true or false?...Ch. 1.2 - Are the statements in Problems 6572 true or false?...Ch. 1.2 - Are the statements in Problems 6572 true or false?...Ch. 1.2 - Are the statements in Problems 6572 true or false?...Ch. 1.2 - Are the statements in Problems 6572 true or false?...Ch. 1.2 - Are the statements in Problems 6572 true or false?...Ch. 1.3 - For the functions f in Exercises 13, graph:...Ch. 1.3 - For the functions f in Exercises 13, graph:...Ch. 1.3 - For the functions f in Exercises 13, graph:...Ch. 1.3 - In Exercises 47, use Figure 1.46 to graph the...Ch. 1.3 - In Exercises 47, use Figure 1.46 to graph the...Ch. 1.3 - In Exercises 47, use Figure 1.46 to graph the...Ch. 1.3 - In Exercises 47, use Figure 1.46 to graph the...Ch. 1.3 - Use Figure 1.47 to graph each of the following....Ch. 1.3 - For the functions f and g in Exercises 912, find...Ch. 1.3 - For the functions f and g in Exercises 912, find...Ch. 1.3 - For the functions f and g in Exercises 912, find...Ch. 1.3 - For the functions f and g in Exercises 912, find...Ch. 1.3 - If f(x)=x2+1, find and simplify:...Ch. 1.3 - For g(x)=x2+2x+3, find and simplify:...Ch. 1.3 - Simplify the quantities in Exercises 1518 using...Ch. 1.3 - Simplify the quantities in Exercises 1518 using...Ch. 1.3 - Simplify the quantities in Exercises 1518 using...Ch. 1.3 - Simplify the quantities in Exercises 1518 using...Ch. 1.3 - Are the functions in Exercises 1926 even, odd, or...Ch. 1.3 - Are the functions in Exercises 1926 even, odd, or...Ch. 1.3 - Are the functions in Exercises 1926 even, odd, or...Ch. 1.3 - Are the functions in Exercises 1926 even, odd, or...Ch. 1.3 - Are the functions in Exercises 1926 even, odd, or...Ch. 1.3 - Are the functions in Exercises 1926 even, odd, or...Ch. 1.3 - Are the functions in Exercises 1926 even, odd, or...Ch. 1.3 - Are the functions in Exercises 1926 even, odd, or...Ch. 1.3 - For Exercises 2728, decide if the function y =...Ch. 1.3 - For Exercises 2728, decide if the function y =...Ch. 1.3 - For Exercises 2931, use a graph of the function to...Ch. 1.3 - For Exercises 2931, use a graph of the function to...Ch. 1.3 - For Exercises 2931, use a graph of the function to...Ch. 1.3 - Let p be the price of an item and q be the number...Ch. 1.3 - Let C = f(A) be the cost, in dollars, of building...Ch. 1.3 - Let f(x) be the temperature (F) when the column of...Ch. 1.3 - (a) Write an equation for a graph obtained by...Ch. 1.3 - How does the graph of Q = S(1 ekt) in Example 4...Ch. 1.3 - In Problems 3738 find possible formulas for the...Ch. 1.3 - In Problems 3738 find possible formulas for the...Ch. 1.3 - In Problems 3942, use Figure 1.48 to estimate the...Ch. 1.3 - In Problems 3942, use Figure 1.48 to estimate the...Ch. 1.3 - In Problems 3942, use Figure 1.48 to estimate the...Ch. 1.3 - In Problems 3942, use Figure 1.48 to estimate the...Ch. 1.3 - For Problems 4348, use the graphs in Figure 1.49....Ch. 1.3 - For Problems 4348, use the graphs in Figure 1.49....Ch. 1.3 - For Problems 4348, use the graphs in Figure 1.49....Ch. 1.3 - For Problems 4348, use the graphs in Figure 1.49....Ch. 1.3 - For Problems 4348, use the graphs in Figure 1.49....Ch. 1.3 - For Problems 4348, use the graphs in Figure 1.49....Ch. 1.3 - For Problems 4952, determine functions f and g...Ch. 1.3 - For Problems 4952, determine functions f and g...Ch. 1.3 - For Problems 4952, determine functions f and g...Ch. 1.3 - For Problems 4952, determine functions f and g...Ch. 1.3 - A tree of height y meters has, on average, B...Ch. 1.3 - Prob. 54ECh. 1.3 - Complete the following table with values for the...Ch. 1.3 - Write a table of values for f1, where f is as...Ch. 1.3 - (a) Use Figure 1.50 to estimate f1(2). (b) Sketch...Ch. 1.3 - For Problems 5861, decide if the function f is...Ch. 1.3 - For Problems 5861, decide if the function f is...Ch. 1.3 - For Problems 5861, decide if the function f is...Ch. 1.3 - For Problems 5861, decide if the function f is...Ch. 1.3 - In Problems 6266, interpret the expression in...Ch. 1.3 - In Problems 6266, interpret the expression in...Ch. 1.3 - In Problems 6266, interpret the expression in...Ch. 1.3 - In Problems 6266, interpret the expression in...Ch. 1.3 - In Problems 6266, interpret the expression in...Ch. 1.3 - In Problems 6770 the functions r = f(t) and V =...Ch. 1.3 - In Problems 6770 the functions r = f(t) and V =...Ch. 1.3 - In Problems 6770 the functions r = f(t) and V =...Ch. 1.3 - In Problems 6770 the functions r = f(t) and V =...Ch. 1.3 - The cost of producing q articles is given by the...Ch. 1.3 - Figure 1.51 shows f(t), the number (in millions)...Ch. 1.3 - Figure 1.52 is a graph of the function f(t). Here...Ch. 1.3 - Figure 1.53 shows graphs of 4 useful functions:...Ch. 1.3 - In Problems 7579, explain what is wrong with the...Ch. 1.3 - In Problems 7579, explain what is wrong with the...Ch. 1.3 - In Problems 7579, explain what is wrong with the...Ch. 1.3 - In Problems 7579, explain what is wrong with the...Ch. 1.3 - In Problems 7579, explain what is wrong with the...Ch. 1.3 - In Problems 8083, give an example of: An...Ch. 1.3 - In Problems 8083, give an example of: An even...Ch. 1.3 - In Problems 8083, give an example of: An...Ch. 1.3 - In Problems 8083, give an example of: Two...Ch. 1.3 - Are the statements in Problems 8493 true or false?...Ch. 1.3 - Are the statements in Problems 8493 true or false?...Ch. 1.3 - Are the statements in Problems 8493 true or false?...Ch. 1.3 - Are the statements in Problems 8493 true or false?...Ch. 1.3 - Are the statements in Problems 8493 true or false?...Ch. 1.3 - Are the statements in Problems 8493 true or false?...Ch. 1.3 - Are the statements in Problems 8493 true or false?...Ch. 1.3 - Are the statements in Problems 8493 true or false?...Ch. 1.3 - Are the statements in Problems 8493 true or false?...Ch. 1.3 - Are the statements in Problems 8493 true or false?...Ch. 1.3 - In Problems 9497, suppose f is an increasing...Ch. 1.3 - In Problems 9497, suppose f is an increasing...Ch. 1.3 - In Problems 9497, suppose f is an increasing...Ch. 1.3 - In Problems 9497, suppose f is an increasing...Ch. 1.4 - In Exercises 16, simplify the expression...Ch. 1.4 - In Exercises 16, simplify the expression...Ch. 1.4 - In Exercises 16, simplify the expression...Ch. 1.4 - In Exercises 16, simplify the expression...Ch. 1.4 - In Exercises 16, simplify the expression...Ch. 1.4 - In Exercises 16, simplify the expression...Ch. 1.4 - For Exercises 718, solve for x using logs. 3x=11Ch. 1.4 - For Exercises 718, solve for x using logs. 17x=2Ch. 1.4 - For Exercises 718, solve for x using logs....Ch. 1.4 - For Exercises 718, solve for x using logs. 43x=75xCh. 1.4 - For Exercises 718, solve for x using logs....Ch. 1.4 - For Exercises 718, solve for x using logs. 2x=ex+1Ch. 1.4 - For Exercises 718, solve for x using logs....Ch. 1.4 - For Exercises 718, solve for x using logs....Ch. 1.4 - For Exercises 718, solve for x using logs....Ch. 1.4 - For Exercises 718, solve for x using logs....Ch. 1.4 - For Exercises 718, solve for x using logs....Ch. 1.4 - For Exercises 718, solve for x using logs....Ch. 1.4 - For Exercises 1924, solve for t. Assume a and b...Ch. 1.4 - For Exercises 1924, solve for t. Assume a and b...Ch. 1.4 - For Exercises 1924, solve for t. Assume a and b...Ch. 1.4 - For Exercises 1924, solve for t. Assume a and b...Ch. 1.4 - For Exercises 1924, solve for t. Assume a and b...Ch. 1.4 - For Exercises 1924, solve for t. Assume a and b...Ch. 1.4 - In Exercises 2528, put the functions in the form...Ch. 1.4 - In Exercises 2528, put the functions in the form...Ch. 1.4 - In Exercises 2528, put the functions in the form...Ch. 1.4 - In Exercises 2528, put the functions in the form...Ch. 1.4 - Find the inverse function in Exercises 2931....Ch. 1.4 - Find the inverse function in Exercises 2931....Ch. 1.4 - Find the inverse function in Exercises 2931....Ch. 1.4 - The exponential function y(x) = Cex satisfies the...Ch. 1.4 - Prob. 33ECh. 1.4 - Prob. 34ECh. 1.4 - A culture of bacteria originally numbers 500....Ch. 1.4 - One hundred kilograms of a radioactive substance...Ch. 1.4 - The population of the US was 281.4 million in 2000...Ch. 1.4 - The population of a region is growing...Ch. 1.4 - Oil consumption in China grew exponentially38 from...Ch. 1.4 - The concentration of the car exhaust fume nitrous...Ch. 1.4 - For children and adults with diseases such as...Ch. 1.4 - The number of alternative fuel vehicles41 running...Ch. 1.4 - A cup of coffee contains 100 mg of caffeine, which...Ch. 1.4 - Persistent organic pollutants (POPS) are a serious...Ch. 1.4 - At time t hours after taking the cough suppressant...Ch. 1.4 - Different isotopes (versions) of the same element...Ch. 1.4 - The size of an exponentially growing bacteria...Ch. 1.4 - Air pressure, P, decreases exponentially with...Ch. 1.4 - With time, t, in years since the start of 1980,...Ch. 1.4 - In November 2010, a tiger summit was held in St....Ch. 1.4 - In 2014, the populations of China and India were...Ch. 1.4 - The revenue of Apple went from54.5 billion in 2013...Ch. 1.4 - The world population was 6.9 billion at the end of...Ch. 1.4 - In the early 1920s, Germany had tremendously high...Ch. 1.4 - In 2010, there were about 246 million vehicles...Ch. 1.4 - Tiny marine organisms reproduce at different...Ch. 1.4 - A picture supposedly painted by Vermeer (16321675)...Ch. 1.4 - Cyanide is used in solution to isolate gold in a...Ch. 1.4 - In 2015, Nepal had two massive earthquakes, the...Ch. 1.4 - Find the equation of the line l in Figure 1.57....Ch. 1.4 - Without a calculator or computer, match the...Ch. 1.4 - Is there a difference between ln(ln(x)) and...Ch. 1.4 - If h(x)=ln(x+a), where a 0, what is the effect of...Ch. 1.4 - If h(x)=ln(x+a), where a 0, what is the effect of...Ch. 1.4 - If g(x)=ln(ax+2), where a 0, what is the effect...Ch. 1.4 - If f(x)=aln(x+2), what is the effect of increasing...Ch. 1.4 - If g(x)=ln(ax+2) where a 0, what is the effect of...Ch. 1.4 - Show that the growth rate k of the exponential...Ch. 1.4 - In Problems 6974, explain what is wrong with the...Ch. 1.4 - In Problems 6974, explain what is wrong with the...Ch. 1.4 - In Problems 6974, explain what is wrong with the...Ch. 1.4 - In Problems 6974, explain what is wrong with the...Ch. 1.4 - In Problems 6974, explain what is wrong with the...Ch. 1.4 - In Problems 6974, explain what is wrong with the...Ch. 1.4 - In Problems 7577, give an example of: A function...Ch. 1.4 - In Problems 7577, give an example of: A function...Ch. 1.4 - In Problems 7577, give an example of: A function...Ch. 1.4 - Are the statements in Problems 7881 true or false?...Ch. 1.4 - Are the statements in Problems 7881 true or false?...Ch. 1.4 - Are the statements in Problems 7881 true or false?...Ch. 1.4 - Are the statements in Problems 7881 true or false?...Ch. 1.5 - For Exercises 19, draw the angle using a ray...Ch. 1.5 - For Exercises 19, draw the angle using a ray...Ch. 1.5 - For Exercises 19, draw the angle using a ray...Ch. 1.5 - For Exercises 19, draw the angle using a ray...Ch. 1.5 - For Exercises 19, draw the angle using a ray...Ch. 1.5 - For Exercises 19, draw the angle using a ray...Ch. 1.5 - For Exercises 19, draw the angle using a ray...Ch. 1.5 - For Exercises 19, draw the angle using a ray...Ch. 1.5 - For Exercises 19, draw the angle using a ray...Ch. 1.5 - Find the period and amplitude in Exercises 1013....Ch. 1.5 - Find the period and amplitude in Exercises 1013....Ch. 1.5 - Find the period and amplitude in Exercises 1013....Ch. 1.5 - Find the period and amplitude in Exercises 1013....Ch. 1.5 - For Exercises 1423, find a possible formula for...Ch. 1.5 - For Exercises 1423, find a possible formula for...Ch. 1.5 - For Exercises 1423, find a possible formula for...Ch. 1.5 - For Exercises 1423, find a possible formula for...Ch. 1.5 - For Exercises 1423, find a possible formula for...Ch. 1.5 - For Exercises 1423, find a possible formula for...Ch. 1.5 - For Exercises 1423, find a possible formula for...Ch. 1.5 - For Exercises 1423, find a possible formula for...Ch. 1.5 - For Exercises 1423, find a possible formula for...Ch. 1.5 - For Exercises 1423, find a possible formula for...Ch. 1.5 - In Exercises 2429, calculate the quantity without...Ch. 1.5 - In Exercises 2429, calculate the quantity without...Ch. 1.5 - In Exercises 2429, calculate the quantity without...Ch. 1.5 - In Exercises 2429, calculate the quantity without...Ch. 1.5 - In Exercises 2429, calculate the quantity without...Ch. 1.5 - In Exercises 2429, calculate the quantity without...Ch. 1.5 - In Exercises 3034, find a solution to the equation...Ch. 1.5 - In Exercises 3034, find a solution to the equation...Ch. 1.5 - In Exercises 3034, find a solution to the equation...Ch. 1.5 - In Exercises 3034, find a solution to the equation...Ch. 1.5 - In Exercises 3034, find a solution to the equation...Ch. 1.5 - What is the period of the earths revolution around...Ch. 1.5 - What is the approximate period of the moons...Ch. 1.5 - When a cars engine makes less than about 200...Ch. 1.5 - A compact disc spins at a rate of 200 to 500...Ch. 1.5 - Find the angle, in degrees, that a wheelchair ramp...Ch. 1.5 - (a) Use a graphing calculator or computer to...Ch. 1.5 - Without a calculator or computer, match the...Ch. 1.5 - Figure 1.73 shows four periodic functions of the...Ch. 1.5 - In Problems 4349, graph the given function on the...Ch. 1.5 - In Problems 4349, graph the given function on the...Ch. 1.5 - In Problems 4349, graph the given function on the...Ch. 1.5 - In Problems 4349, graph the given function on the...Ch. 1.5 - In Problems 4349, graph the given function on the...Ch. 1.5 - In Problems 4349, graph the given function on the...Ch. 1.5 - In Problems 4349, graph the given function on the...Ch. 1.5 - For Problems 5053, use Figure 1.75 to estimate the...Ch. 1.5 - For Problems 5053, use Figure 1.75 to estimate the...Ch. 1.5 - For Problems 5053, use Figure 1.75 to estimate the...Ch. 1.5 - For Problems 5053, use Figure 1.75 to estimate the...Ch. 1.5 - For Problems 5457, use Figure 1.75 to estimate the...Ch. 1.5 - For Problems 5457, use Figure 1.75 to estimate the...Ch. 1.5 - For Problems 5457, use Figure 1.75 to estimate the...Ch. 1.5 - For Problems 5457, use Figure 1.75 to estimate the...Ch. 1.5 - The visitors guide to St. Petersburg, Florida,...Ch. 1.5 - What is the difference between sin x2, sin2 x, and...Ch. 1.5 - On the graph of y = sin x, points P and Q are at...Ch. 1.5 - A population of animals oscillates sinusoidally...Ch. 1.5 - The desert temperature, H, oscillates daily...Ch. 1.5 - The depth of water in a tank oscillates...Ch. 1.5 - The voltage, V, of an electrical outlet in a home...Ch. 1.5 - The power output, P, of a solar panel varies with...Ch. 1.5 - A baseball hit at an angle of to the horizontal...Ch. 1.5 - (a) Match the functions = f(t), = g(t), = (t), ...Ch. 1.5 - For a boat to float in a tidal bay, the water must...Ch. 1.5 - The Bay of Fundy in Canada has the largest tides...Ch. 1.5 - Match graphs A-D in Figure 1.78 with the functions...Ch. 1.5 - In Figure 1.79, the blue curve shows monthly mean...Ch. 1.5 - Find the area of the trapezoidal cross-section of...Ch. 1.5 - Graph y = sin x, y = 0.4, and y = 0.4. (a) From...Ch. 1.5 - This problem introduces the arccosine function, or...Ch. 1.5 - In Problems 7578, explain what is wrong with the...Ch. 1.5 - In Problems 7578, explain what is wrong with the...Ch. 1.5 - In Problems 7578, explain what is wrong with the...Ch. 1.5 - In Problems 7578, explain what is wrong with the...Ch. 1.5 - In Problems 7980, give an example of: A sine...Ch. 1.5 - In Problems 7980, give an example of: A cosine...Ch. 1.5 - Are the statements in Problems 8197 true or false?...Ch. 1.5 - Are the statements in Problems 8197 true or false?...Ch. 1.5 - Are the statements in Problems 8197 true or false?...Ch. 1.5 - Are the statements in Problems 8197 true or false?...Ch. 1.5 - Are the statements in Problems 8197 true or false?...Ch. 1.5 - Are the statements in Problems 8197 true or false?...Ch. 1.5 - Are the statements in Problems 8197 true or false?...Ch. 1.5 - Are the statements in Problems 8197 true or false?...Ch. 1.5 - Are the statements in Problems 8197 true or false?...Ch. 1.5 - Are the statements in Problems 8197 true or false?...Ch. 1.5 - Are the statements in Problems 8197 true or false?...Ch. 1.5 - Are the statements in Problems 8197 true or false?...Ch. 1.5 - Are the statements in Problems 8197 true or false?...Ch. 1.5 - Are the statements in Problems 8197 true or false?...Ch. 1.5 - Are the statements in Problems 8197 true or false?...Ch. 1.5 - Are the statements in Problems 8197 true or false?...Ch. 1.5 - Are the statements in Problems 8197 true or false?...Ch. 1.6 - For Exercises 12, what happens to the value of the...Ch. 1.6 - For Exercises 12, what happens to the value of the...Ch. 1.6 - In Exercises 310, determine the end behavior of...Ch. 1.6 - In Exercises 310, determine the end behavior of...Ch. 1.6 - In Exercises 310, determine the end behavior of...Ch. 1.6 - In Exercises 310, determine the end behavior of...Ch. 1.6 - In Exercises 310, determine the end behavior of...Ch. 1.6 - In Exercises 310, determine the end behavior of...Ch. 1.6 - In Exercises 310, determine the end behavior of...Ch. 1.6 - In Exercises 310, determine the end behavior of...Ch. 1.6 - In Exercises 1116, which function dominates as x ...Ch. 1.6 - In Exercises 1116, which function dominates as x ...Ch. 1.6 - In Exercises 1116, which function dominates as x ...Ch. 1.6 - In Exercises 1116, which function dominates as x ...Ch. 1.6 - In Exercises 1116, which function dominates as x ...Ch. 1.6 - In Exercises 1116, which function dominates as x ...Ch. 1.6 - Each of the graphs in Figure 1.89 is of a...Ch. 1.6 - Find cubic polynomials for the graphs in Exercises...Ch. 1.6 - Find cubic polynomials for the graphs in Exercises...Ch. 1.6 - Find possible formulas for the graphs in Exercises...Ch. 1.6 - Find possible formulas for the graphs in Exercises...Ch. 1.6 - Find possible formulas for the graphs in Exercises...Ch. 1.6 - Find possible formulas for the graphs in Exercises...Ch. 1.6 - In Exercises 2426, choose the functions that are...Ch. 1.6 - In Exercises 2426, choose the functions that are...Ch. 1.6 - In Exercises 2426, choose the functions that are...Ch. 1.6 - In Exercises 2732, choose each of the families the...Ch. 1.6 - In Exercises 2732, choose each of the families the...Ch. 1.6 - In Exercises 2732, choose each of the families the...Ch. 1.6 - In Exercises 2732, choose each of the families the...Ch. 1.6 - In Exercises 2732, choose each of the families the...Ch. 1.6 - In Exercises 2732, choose each of the families the...Ch. 1.6 - In Exercises 3340, which of the following...Ch. 1.6 - In Exercises 3340, which of the following...Ch. 1.6 - In Exercises 3340, which of the following...Ch. 1.6 - In Exercises 3340, which of the following...Ch. 1.6 - In Exercises 3340, which of the following...Ch. 1.6 - In Exercises 3340, which of the following...Ch. 1.6 - In Exercises 3340, which of the following...Ch. 1.6 - In Exercises 3340, which of the following...Ch. 1.6 - For Exercises 4144, assuming the window is large...Ch. 1.6 - For Exercises 4144, assuming the window is large...Ch. 1.6 - For Exercises 4144, assuming the window is large...Ch. 1.6 - For Exercises 4144, assuming the window is large...Ch. 1.6 - How many distinct roots can a polynomial of degree...Ch. 1.6 - Find a calculator window in which the graphs of...Ch. 1.6 - A cubic polynomial with positive leading...Ch. 1.6 - (a) If f(x)=ax2+bx+c, what can you say about the...Ch. 1.6 - A box of fixed volume V has a square base with...Ch. 1.6 - Prob. 50ECh. 1.6 - The DuBois formula relates a persons surface area...Ch. 1.6 - According to Car and Driver, an Alfa Romeo going...Ch. 1.6 - Poiseuilles Law gives the rate of flow, R, of a...Ch. 1.6 - A pomegranate is thrown from ground level straight...Ch. 1.6 - The height of an object above the ground at time t...Ch. 1.6 - The rate, R, at which a population in a confined...Ch. 1.6 - In Problems 5761, the length of a plant, L, is a...Ch. 1.6 - In Problems 5761, the length of a plant, L, is a...Ch. 1.6 - In Problems 5761, the length of a plant, L, is a...Ch. 1.6 - In Problems 5761, the length of a plant, L, is a...Ch. 1.6 - In Problems 5761, the length of a plant, L, is a...Ch. 1.6 - In Problems 6264, find all horizontal and vertical...Ch. 1.6 - In Problems 6264, find all horizontal and vertical...Ch. 1.6 - In Problems 6264, find all horizontal and vertical...Ch. 1.6 - For each function, fill in the blanks in the...Ch. 1.6 - A rational function y = f(x) is graphed in Figure...Ch. 1.6 - After running 3miles at a speed of x mph, a man...Ch. 1.6 - Which of the functions IIII meet each of the...Ch. 1.6 - Values of three functions are given in Table 1.19,...Ch. 1.6 - Use a graphing calculator or a computer to graph y...Ch. 1.6 - Prob. 71ECh. 1.6 - When an object of mass m moves with a velocity v...Ch. 1.6 - If y = 100x0.2 and z = ln x, explain why y is an...Ch. 1.6 - In Problems 7479, explain what is wrong with the...Ch. 1.6 - In Problems 7479, explain what is wrong with the...Ch. 1.6 - In Problems 7479, explain what is wrong with the...Ch. 1.6 - In Problems 7479, explain what is wrong with the...Ch. 1.6 - In Problems 7479, explain what is wrong with the...Ch. 1.6 - In Problems 7479, explain what is wrong with the...Ch. 1.6 - In Problems 8085, give an example of: polynomial...Ch. 1.6 - In Problems 8085, give an example of: A rational...Ch. 1.6 - In Problems 8085, give an example of: A rational...Ch. 1.6 - In Problems 8085, give an example of: A function...Ch. 1.6 - In Problems 8085, give an example of: A function...Ch. 1.6 - In Problems 8085, give an example of: A function...Ch. 1.6 - Are the statements in Problems 8689 true or false?...Ch. 1.6 - Are the statements in Problems 8689 true or false?...Ch. 1.6 - Are the statements in Problems 8689 true or false?...Ch. 1.6 - Are the statements in Problems 8689 true or false?...Ch. 1.6 - List the following functions in order from...Ch. 1.7 - (a) Using Figure 1.108, find all values of x for...Ch. 1.7 - (a) Using Figure 1.109, find all values of x for...Ch. 1.7 - Use the graph of f(x) in Figure 1.110 to give...Ch. 1.7 - In Exercises 45, the graph of y = f(x) is given....Ch. 1.7 - In Exercises 45, the graph of y = f(x) is given....Ch. 1.7 - Assume f(x) is continuous on an interval around x...Ch. 1.7 - Assume g(t) is continuous on an interval around t...Ch. 1.7 - In Exercises 89, (a) Make a table of values of...Ch. 1.7 - In Exercises 89, (a) Make a table of values of...Ch. 1.7 - Use a table of values to estimate limx1(5+lnx).Ch. 1.7 - In Exercises 1116, is the function continuous on...Ch. 1.7 - In Exercises 1116, is the function continuous on...Ch. 1.7 - In Exercises 1116, is the function continuous on...Ch. 1.7 - In Exercises 1116, is the function continuous on...Ch. 1.7 - In Exercises 1116, is the function continuous on...Ch. 1.7 - In Exercises 1116, is the function continuous on...Ch. 1.7 - Are the following functions continuous? Explain....Ch. 1.7 - Let f be the function given by...Ch. 1.7 - In Exercises 1922, show there is a number c, with...Ch. 1.7 - In Exercises 1922, show there is a number c, with...Ch. 1.7 - In Exercises 1922, show there is a number c, with...Ch. 1.7 - In Exercises 1922, show there is a number c, with...Ch. 1.7 - In Exercises 2328, use algebra to find the limit...Ch. 1.7 - In Exercises 2328, use algebra to find the limit...Ch. 1.7 - In Exercises 2328, use algebra to find the limit...Ch. 1.7 - In Exercises 2328, use algebra to find the limit...Ch. 1.7 - In Exercises 2328, use algebra to find the limit...Ch. 1.7 - In Exercises 2328, use algebra to find the limit...Ch. 1.7 - For Exercises 2930, find the value of the constant...Ch. 1.7 - For Exercises 2930, find the value of the constant...Ch. 1.7 - In Exercises 3134 find k so that the function is...Ch. 1.7 - In Exercises 3134 find k so that the function is...Ch. 1.7 - In Exercises 3134 find k so that the function is...Ch. 1.7 - In Exercises 3134 find k so that the function is...Ch. 1.7 - Which of the following are continuous functions of...Ch. 1.7 - An electrical circuit switches instantaneously...Ch. 1.7 - A stone dropped from the top of a cliff falls...Ch. 1.7 - Beginning at time t = 0, a car undergoing a crash...Ch. 1.7 - Discuss the continuity of the function g graphed...Ch. 1.7 - Is the following function continuous on [1, 1]?...Ch. 1.7 - Estimate the limits in Problems 4142 graphically....Ch. 1.7 - Estimate the limits in Problems 4142 graphically....Ch. 1.7 - In Problems 4348, use a graph to estimate the...Ch. 1.7 - In Problems 4348, use a graph to estimate the...Ch. 1.7 - In Problems 4348, use a graph to estimate the...Ch. 1.7 - In Problems 4348, use a graph to estimate the...Ch. 1.7 - In Problems 4348, use a graph to estimate the...Ch. 1.7 - In Problems 4348, use a graph to estimate the...Ch. 1.7 - In Problems 4954, find a value of k, if any,...Ch. 1.7 - In Problems 4954, find a value of k, if any,...Ch. 1.7 - In Problems 4954, find a value of k, if any,...Ch. 1.7 - In Problems 4954, find a value of k, if any,...Ch. 1.7 - In Problems 4954, find a value of k, if any,...Ch. 1.7 - In Problems 4954, find a value of k, if any,...Ch. 1.7 - (a) Use Figure 1.115 to decide at what points f(x)...Ch. 1.7 - For t in months, a population, in thousands, is...Ch. 1.7 - A 0.6ml dose of a drug is injected into a patient...Ch. 1.7 - In Problems 5861, at what values of x is the...Ch. 1.7 - In Problems 5861, at what values of x is the...Ch. 1.7 - In Problems 5861, at what values of x is the...Ch. 1.7 - In Problems 5861, at what values of x is the...Ch. 1.7 - In Problems 6265, is the function continuous for...Ch. 1.7 - In Problems 6265, is the function continuous for...Ch. 1.7 - In Problems 6265, is the function continuous for...Ch. 1.7 - In Problems 6265, is the function continuous for...Ch. 1.7 - Graph three different functions, continuous on 0 ...Ch. 1.7 - Let p(x) be a cubic polynomial with p(5) 0, p(10)...Ch. 1.7 - (a) What does a graph of y = ex and y = 4 x2 tell...Ch. 1.7 - (a) Does f(x) satisfy the conditions for the...Ch. 1.7 - Let g(x) be continuous with g(0) = 3, g(1) = 8,...Ch. 1.7 - By graphing y = (1 + x)1x, estimate limx0(1+x)1/x....Ch. 1.7 - Investigate limh0(1+h)1/h numerically.Ch. 1.7 - Let f(x) = sin(1x). (a) Find a sequence of...Ch. 1.7 - In Problems 7476, explain what is wrong with the...Ch. 1.7 - In Problems 7476, explain what is wrong with the...Ch. 1.7 - In Problems 7476, explain what is wrong with the...Ch. 1.7 - In Problems 7780, give an example of: A function...Ch. 1.7 - In Problems 7780, give an example of: A function...Ch. 1.7 - In Problems 7780, give an example of: A function...Ch. 1.7 - In Problems 7780, give an example of: A function...Ch. 1.7 - Are the statements in Problems 8183 true or false?...Ch. 1.7 - Are the statements in Problems 8183 true or false?...Ch. 1.7 - Are the statements in Problems 8183 true or false?...Ch. 1.8 - Use Figure 1.121 to find the limits or explain why...Ch. 1.8 - Use Figure 1.122 to estimate the following limits,...Ch. 1.8 - Use Figure 1.123 to find each of the following or...Ch. 1.8 - Use Figure 1.124 to find each of the following or...Ch. 1.8 - Use Figure 1.125 to estimate the following limits....Ch. 1.8 - In Exercises 68, calculate the limit using the...Ch. 1.8 - In Exercises 68, calculate the limit using the...Ch. 1.8 - In Exercises 68, calculate the limit using the...Ch. 1.8 - Using Figures 1.126 and 1.127, estimate...Ch. 1.8 - In Exercises 1015, draw a possible graph of f(x)....Ch. 1.8 - In Exercises 1015, draw a possible graph of f(x)....Ch. 1.8 - In Exercises 1015, draw a possible graph of f(x)....Ch. 1.8 - In Exercises 1015, draw a possible graph of f(x)....Ch. 1.8 - In Exercises 1015, draw a possible graph of f(x)....Ch. 1.8 - In Exercises 1015, draw a possible graph of f(x)....Ch. 1.8 - In Exercises 1628, find the limits using your...Ch. 1.8 - In Exercises 1628, find the limits using your...Ch. 1.8 - In Exercises 1628, find the limits using your...Ch. 1.8 - In Exercises 1628, find the limits using your...Ch. 1.8 - In Exercises 1628, find the limits using your...Ch. 1.8 - In Exercises 1628, find the limits using your...Ch. 1.8 - In Exercises 1628, find the limits using your...Ch. 1.8 - In Exercises 1628, find the limits using your...Ch. 1.8 - In Exercises 1628, find the limits using your...Ch. 1.8 - In Exercises 1628, find the limits using your...Ch. 1.8 - In Exercises 1628, find the limits using your...Ch. 1.8 - In Exercises 1628, find the limits using your...Ch. 1.8 - In Exercises 1628, find the limits using your...Ch. 1.8 - In Exercises 2934, give limxf(x)andlimx+f(x)....Ch. 1.8 - In Exercises 2934, give limxf(x)andlimx+f(x)....Ch. 1.8 - In Exercises 2934, give limxf(x)andlimx+f(x)....Ch. 1.8 - In Exercises 2934, give limxf(x)andlimx+f(x)....Ch. 1.8 - In Exercises 2934, give limxf(x)andlimx+f(x)....Ch. 1.8 - In Exercises 2934, give limxf(x)andlimx+f(x)....Ch. 1.8 - Does f(x)=|x|x have right or left limits at 0? Is...Ch. 1.8 - Exercises 3638, use algebra to evaluate...Ch. 1.8 - Exercises 3638, use algebra to evaluate...Ch. 1.8 - Exercises 3638, use algebra to evaluate...Ch. 1.8 - By graphing y=(1+1/x)x, estimate limx(1+1/x)x. You...Ch. 1.8 - Investigate limx(1+1/x)x numerically.Ch. 1.8 - (a) Sketch f(x)=e1/(x2+0.0001) around x = 0. (b)...Ch. 1.8 - What does a calculator suggest about limx0+xe1/x?...Ch. 1.8 - In Problems 4352, evaluate limx for the function....Ch. 1.8 - In Problems 4352, evaluate limx for the function....Ch. 1.8 - In Problems 4352, evaluate limx for the function....Ch. 1.8 - In Problems 4352, evaluate limx for the function....Ch. 1.8 - In Problems 4352, evaluate limx for the function....Ch. 1.8 - In Problems 4352, evaluate limx for the function....Ch. 1.8 - In Problems 4352, evaluate limx for the function....Ch. 1.8 - In Problems 4352, evaluate limx for the function....Ch. 1.8 - In Problems 4352, evaluate limx for the function....Ch. 1.8 - In Problems 4352, evaluate limx for the function....Ch. 1.8 - (a) Sketch the graph of a continuous function f...Ch. 1.8 - Sketch the graph of a function f with all of the...Ch. 1.8 - Sketch the graph of a function f with all of the...Ch. 1.8 - The graph of f(x) has a horizontal asymptote at y...Ch. 1.8 - A patient takes a 100 mg dose of a drug once daily...Ch. 1.8 - If p(x) is the function on page 58 giving the...Ch. 1.8 - Evaluate limx3x2+5xx+9 using the limit properties....Ch. 1.8 - Let limxf(x)=andlimxg(x)=. Give possible formulas...Ch. 1.8 - (a) Rewrite 1x510x225 in the form f(x)/g(x) for...Ch. 1.8 - In Problems 6263, modify the definition of limit...Ch. 1.8 - In Problems 6263, modify the definition of limit...Ch. 1.8 - Use Theorem 1.2 on page 71 to explain why if f and...Ch. 1.8 - In Problems 6566, explain what is wrong with the...Ch. 1.8 - In Problems 6566, explain what is wrong with the...Ch. 1.8 - In Problems 6768, give an example of: A rational...Ch. 1.8 - In Problems 6768, give an example of: A function...Ch. 1.8 - Suppose that limx3f(x)=7. Are the statements in...Ch. 1.8 - Suppose that limx3f(x)=7. Are the statements in...Ch. 1.8 - Suppose that limx3f(x)=7. Are the statements in...Ch. 1.8 - Suppose that limx3f(x)=7. Are the statements in...Ch. 1.8 - Suppose that limx3f(x)=7. Are the statements in...Ch. 1.8 - In Problems 7479, is the statement true or false?...Ch. 1.8 - In Problems 7479, is the statement true or false?...Ch. 1.8 - In Problems 7479, is the statement true or false?...Ch. 1.8 - In Problems 7479, is the statement true or false?...Ch. 1.8 - In Problems 7479, is the statement true or false?...Ch. 1.8 - In Problems 7479, is the statement true or false?...Ch. 1.8 - In Problems 8081, let f(x) = (1/x) sin(1/x). Is...Ch. 1.8 - In Problems 8081, let f(x) = (1/x) sin(1/x). Is...Ch. 1.9 - In Exercises 13, find the limit. limx03x2x2Ch. 1.9 - In Exercises 13, find the limit. limx03x2xCh. 1.9 - In Exercises 13, find the limit. limx03x2x4Ch. 1.9 - For Exercises 423, use algebra to simplify the...Ch. 1.9 - For Exercises 423, use algebra to simplify the...Ch. 1.9 - For Exercises 423, use algebra to simplify the...Ch. 1.9 - For Exercises 423, use algebra to simplify the...Ch. 1.9 - For Exercises 423, use algebra to simplify the...Ch. 1.9 - For Exercises 423, use algebra to simplify the...Ch. 1.9 - For Exercises 423, use algebra to simplify the...Ch. 1.9 - For Exercises 423, use algebra to simplify the...Ch. 1.9 - For Exercises 423, use algebra to simplify the...Ch. 1.9 - For Exercises 423, use algebra to simplify the...Ch. 1.9 - For Exercises 423, use algebra to simplify the...Ch. 1.9 - For Exercises 423, use algebra to simplify the...Ch. 1.9 - For Exercises 423, use algebra to simplify the...Ch. 1.9 - For Exercises 423, use algebra to simplify the...Ch. 1.9 - For Exercises 423, use algebra to simplify the...Ch. 1.9 - For Exercises 423, use algebra to simplify the...Ch. 1.9 - For Exercises 423, use algebra to simplify the...Ch. 1.9 - For Exercises 423, use algebra to simplify the...Ch. 1.9 - For Exercises 423, use algebra to simplify the...Ch. 1.9 - For Exercises 423, use algebra to simplify the...Ch. 1.9 - In Exercises 2426, for the given constant c and...Ch. 1.9 - In Exercises 2426, for the given constant c and...Ch. 1.9 - In Exercises 2426, for the given constant c and...Ch. 1.9 - In Exercises 2734, use algebra to evaluate the...Ch. 1.9 - In Exercises 2734, use algebra to evaluate the...Ch. 1.9 - In Exercises 2734, use algebra to evaluate the...Ch. 1.9 - In Exercises 2734, use algebra to evaluate the...Ch. 1.9 - In Exercises 2734, use algebra to evaluate the...Ch. 1.9 - In Exercises 2734, use algebra to evaluate the...Ch. 1.9 - In Exercises 2734, use algebra to evaluate the...Ch. 1.9 - In Exercises 2734, use algebra to evaluate the...Ch. 1.9 - Find limx1f(x) if, for all x, 4x + 6 f(x) x2 2x...Ch. 1.9 - Find limx0f(x) if, for all x, 4 cos(2x) f(x) 3x2...Ch. 1.9 - Find limxf(x) if, for x 0, 4x25x2f(x)4x6+3x6Ch. 1.9 - In Problems 3849, find all values for the constant...Ch. 1.9 - In Problems 3849, find all values for the constant...Ch. 1.9 - In Problems 3849, find all values for the constant...Ch. 1.9 - In Problems 3849, find all values for the constant...Ch. 1.9 - In Problems 3849, find all values for the constant...Ch. 1.9 - In Problems 3849, find all values for the constant...Ch. 1.9 - In Problems 3849, find all values for the constant...Ch. 1.9 - In Problems 3849, find all values for the constant...Ch. 1.9 - In Problems 3849, find all values for the constant...Ch. 1.9 - In Problems 3849, find all values for the constant...Ch. 1.9 - In Problems 3849, find all values for the constant...Ch. 1.9 - In Problems 3849, find all values for the constant...Ch. 1.9 - In Problems 5055, use the indicated new variable...Ch. 1.9 - In Problems 5055, use the indicated new variable...Ch. 1.9 - In Problems 5055, use the indicated new variable...Ch. 1.9 - In Problems 5055, use the indicated new variable...Ch. 1.9 - In Problems 5055, use the indicated new variable...Ch. 1.9 - In Problems 5055, use the indicated new variable...Ch. 1.9 - Use the Squeeze Theorem to prove limxsinxx=0.Ch. 1.9 - Use the Squeeze Theorem to prove limx1x+ex=0.Ch. 1.9 - In Problems 5861, use the Squeeze Theorem to...Ch. 1.9 - In Problems 5861, use the Squeeze Theorem to...Ch. 1.9 - In Problems 5861, use the Squeeze Theorem to...Ch. 1.9 - In Problems 5861, use the Squeeze Theorem to...Ch. 1.9 - Let limxf(x)=0 and limxg(x)=0. Give possible...Ch. 1.9 - In Problems 6366, for the given constant c and...Ch. 1.9 - In Problems 6366, for the given constant c and...Ch. 1.9 - In Problems 6366, for the given constant c and...Ch. 1.9 - In Problems 6366, for the given constant c and...Ch. 1.9 - In Problems 6772, for the given m and n, evaluate...Ch. 1.9 - In Problems 6772, for the given m and n, evaluate...Ch. 1.9 - In Problems 6772, for the given m and n, evaluate...Ch. 1.9 - In Problems 6772, for the given m and n, evaluate...Ch. 1.9 - In Problems 6772, for the given m and n, evaluate...Ch. 1.9 - In Problems 6772, for the given m and n, evaluate...Ch. 1.9 - For any f(x), where 1xf(x)1x, find values of c,...Ch. 1.9 - In Problems 7475, explain what is wrong with the...Ch. 1.9 - In Problems 7475, explain what is wrong with the...Ch. 1.9 - Are the statements in Problems 7683 true or false?...Ch. 1.9 - Are the statements in Problems 7683 true or false?...Ch. 1.9 - Are the statements in Problems 7683 true or false?...Ch. 1.9 - Are the statements in Problems 7683 true or false?...Ch. 1.9 - Are the statements in Problems 7683 true or false?...Ch. 1.9 - Are the statements in Problems 7683 true or false?...Ch. 1.9 - Are the statements in Problems 7683 true or false?...Ch. 1.9 - Are the statements in Problems 7683 true or false?...Ch. 1.10 - Figure 1.5 shows f(x) and the region |f(x) L| e....Ch. 1.10 - Figure 1.6 shows g(x) and the region |g(x) L| ....Ch. 1.10 - In Exercises 34, for each value of , find a...Ch. 1.10 - In Exercises 34, for each value of , find a...Ch. 1.10 - In Exercises 58, for the given limit limxcf(x)=L,...Ch. 1.10 - In Exercises 58, for the given limit limxcf(x)=L,...Ch. 1.10 - In Exercises 58, for the given limit limxcf(x)=L,...Ch. 1.10 - In Exercises 58, for the given limit limxcf(x)=L,...Ch. 1.10 - Write the definition of the following statement...Ch. 1.10 - In Problems 1011, for each value of , find a...Ch. 1.10 - In Problems 1011, for each value of , find a...Ch. 1.10 - In Problems 1216, for the given limit limxcf(x)=L,...Ch. 1.10 - In Problems 1216, for the given limit limxcf(x)=L,...Ch. 1.10 - In Problems 1216, for the given limit limxcf(x)=L,...Ch. 1.10 - In Problems 1216, for the given limit limxcf(x)=L,...Ch. 1.10 - In Problems 1216, for the given limit limxcf(x)=L,...Ch. 1.10 - In Problems 1718, for the given function do the...Ch. 1.10 - In Problems 1718, for the given function do the...Ch. 1.10 - For Problems 1925, use the definition of limit to...Ch. 1.10 - For Problems 1925, use the definition of limit to...Ch. 1.10 - For Problems 1925, use the definition of limit to...Ch. 1.10 - For Problems 1925, use the definition of limit to...Ch. 1.10 - For Problems 1925, use the definition of limit to...Ch. 1.10 - For Problems 1925, use the definition of limit to...Ch. 1.10 - For Problems 1925, use the definition of limit to...Ch. 1.10 - Let f(x) = sin(l/x) (see Figure 1.7). Show that...Ch. 1.10 - Show that the following functions are both...Ch. 1.10 - In Problems 2830, modify the definition of limit...Ch. 1.10 - In Problems 2830, modify the definition of limit...Ch. 1.10 - In Problems 2830, modify the definition of limit...Ch. 1.10 - This problem suggests a proof of the first...Ch. 1.10 - Prove the second property of limits:...Ch. 1.10 - This problem suggests a proof of the third...Ch. 1.10 - Suppose that limx3f(x)=7. Are the statements in...Ch. 1.10 - Suppose that limx3f(x)=7. Are the statements in...Ch. 1.10 - Which of the statements in Problems 36-40 are true...Ch. 1.10 - Which of the statements in Problems 36-40 are true...Ch. 1.10 - Which of the statements in Problems 36-40 are true...Ch. 1.10 - Which of the statements in Problems 36-40 are true...Ch. 1.10 - Which of the statements in Problems 36-40 are true...Ch. 1 - Find formulas for the functions described in...Ch. 1 - Find formulas for the functions described in...Ch. 1 - Find formulas for the functions described in...Ch. 1 - Find formulas for the functions described in...Ch. 1 - Find formulas for the functions described in...Ch. 1 - Find formulas for the functions described in...Ch. 1 - Find formulas for the functions described in...Ch. 1 - Find formulas for the functions described in...Ch. 1 - Find derivatives for the functions in Exercises...Ch. 1 - If g(x) = (4 x2)/(x2 + x), find the domain of...Ch. 1 - The entire graph of f(x) is shown in Figure 1.1....Ch. 1 - For f(n) = 3n2 2 and g(n) = n +1, find and...Ch. 1 - Let m = f(A) be the minimum annual gross income,...Ch. 1 - For Exercises 1417, solve for t using logs. 5t = 7Ch. 1 - For Exercises 1417, solve for t using logs. 2 =...Ch. 1 - For Exercises 1417, solve for t using logs. 7 3t...Ch. 1 - For Exercises 1417, solve for t using logs....Ch. 1 - In Exercises 1819, put the functions in the form P...Ch. 1 - In Exercises 1819, put the functions in the form P...Ch. 1 - For Exercises 2021, find functions f and g such...Ch. 1 - For Exercises 2021, find functions f and g such...Ch. 1 - Find the amplitudes and periods in Exercises 2223....Ch. 1 - Find the amplitudes and periods in Exercises 2223....Ch. 1 - Consider the function y = 5 + cos(3x). (a) What is...Ch. 1 - Determine the end behavior of each function as x ...Ch. 1 - In Exercises 2627, which function dominates as x ...Ch. 1 - In Exercises 2627, which function dominates as x ...Ch. 1 - Find possible formulas for the graphs in Exercises...Ch. 1 - Find possible formulas for the graphs in Exercises...Ch. 1 - Find possible formulas for the graphs in Exercises...Ch. 1 - Find possible formulas for the graphs in Exercises...Ch. 1 - Find possible formulas for the graphs in Exercises...Ch. 1 - Find possible formulas for the graphs in Exercises...Ch. 1 - Find possible formulas for the graphs in Exercises...Ch. 1 - Find possible formulas for the graphs in Exercises...Ch. 1 - Find possible formulas for the graphs in Exercises...Ch. 1 - Find possible formulas for the graphs in Exercises...Ch. 1 - Find possible formulas for the graphs in Exercises...Ch. 1 - Find possible formulas for the graphs in Exercises...Ch. 1 - Find possible formulas for the graphs in Exercises...Ch. 1 - Find possible formulas for the graphs in Exercises...Ch. 1 - Are the functions in Exercises 4243 continuous on...Ch. 1 - Are the functions in Exercises 4243 continuous on...Ch. 1 - Use Figure 1.2 to estimate the limits if they...Ch. 1 - For the functions in Exercises 4546, use algebra...Ch. 1 - For the functions in Exercises 4546, use algebra...Ch. 1 - Use the graph of g(t) in Figure 1.3 to give...Ch. 1 - Use Figure 1.4 to give approximate values for the...Ch. 1 - In Exercises 4952, is the function continuous on...Ch. 1 - In Exercises 4952, is the function continuous on...Ch. 1 - In Exercises 4952, is the function continuous on...Ch. 1 - In Exercises 4952, is the function continuous on...Ch. 1 - Use a graph to estimate each of the limits in...Ch. 1 - Use a graph to estimate each of the limits in...Ch. 1 - Use a graph to estimate each of the limits in...Ch. 1 - Use a graph to estimate each of the limits in...Ch. 1 - In Exercises 5758, (a) Make a table of values of...Ch. 1 - In Exercises 5758, (a) Make a table of values of...Ch. 1 - For Exercises 5961, use the end behavior of the...Ch. 1 - For Exercises 5961, use the end behavior of the...Ch. 1 - For Exercises 5961, use the end behavior of the...Ch. 1 - For Exercises 6263, create a function, f(x), such...Ch. 1 - For Exercises 6263, create a function, f(x), such...Ch. 1 - Evaluate the limits of the following function, or...Ch. 1 - Evaluate the limits of the following function, or...Ch. 1 - Evaluate the limits of the following function, or...Ch. 1 - In Exercises 6772, use algebra to find the limit...Ch. 1 - In Exercises 6772, use algebra to find the limit...Ch. 1 - In Exercises 6772, use algebra to find the limit...Ch. 1 - In Exercises 6772, use algebra to find the limit...Ch. 1 - In Exercises 6772, use algebra to find the limit...Ch. 1 - In Exercises 6772, use algebra to find the limit...Ch. 1 - The yield, Y, of an apple orchard (in bushels) as...Ch. 1 - The graph of Fahrenheit temperature, F, as a...Ch. 1 - The demand function for a certain product, q =...Ch. 1 - A flight from Dulles Airport in Washington, DC, to...Ch. 1 - The force, F, between two atoms depends on the...Ch. 1 - When the Olympic Games were held outside Mexico...Ch. 1 - The population of the Ukraine fell from 46.01...Ch. 1 - During April 2006, Zimbabwes inflation rate...Ch. 1 - A kilogram weighs about 2.2 pounds. (a) Write a...Ch. 1 - The graph of f(x) is a parabola that opens upward...Ch. 1 - Each of the functions in the table is increasing...Ch. 1 - A culture of 100 bacteria doubles after 2 hours....Ch. 1 - If f(x) = a ln(x + 2), how does increasing a...Ch. 1 - What is the doubling time of prices which are...Ch. 1 - Find the half-life of a radioactive substance that...Ch. 1 - The air in a factory is being filtered so that the...Ch. 1 - The half-life of radioactive strontium-90 is 29...Ch. 1 - What is the period of the motion of the minute...Ch. 1 - In an electrical outlet, the voltage, V, in volts,...Ch. 1 - In a US household, the voltage in volts in an...Ch. 1 - (a) How does the parameter A affect the graph of y...Ch. 1 - Water is flowing down a cylindrical pipe of radius...Ch. 1 - Values of three functions are given in Table 1.1,...Ch. 1 - Figure 1.8 shows the hat function...Ch. 1 - The point P moves around the circle of radius 5...Ch. 1 - Match the following functions with the graphs in...Ch. 1 - Use a computer or calculator to sketch the...Ch. 1 - If possible, choose k so that the following...Ch. 1 - Find k so that the following function is...Ch. 1 - A car is coasting down a hill at a constant speed....Ch. 1 - By graphing y = 3 2et estimate the limit...Ch. 1 - Evaluate the limits of the following function, or...Ch. 1 - (a) For k = 1, sketch f(x)={kx0x2(x2)2+32x4. (b)...Ch. 1 - (a) Graph a continuous function g with all the...Ch. 1 - In Problems 108111, let g(t) be a function whose...Ch. 1 - In Problems 108111, let g(t) be a function whose...Ch. 1 - In Problems 108111, let g(t) be a function whose...Ch. 1 - In Problems 108111, let g(t) be a function whose...Ch. 1 - In Problems 112113, use the given value of f(5)...Ch. 1 - In Problems 112113, use the given value of f(5)...Ch. 1 - In Problems 114116, find the limits....Ch. 1 - In Problems 114116, find the limits. limh0x+hxhCh. 1 - In Problems 114116, find the limits....Ch. 1 - For Problems 117120, if possible, calculate the...Ch. 1 - For Problems 117120, if possible, calculate the...Ch. 1 - For Problems 117120, if possible, calculate the...Ch. 1 - For problems 117-120, if possible, calculate the...Ch. 1 - For Problems 121124, evaluate the limit, using the...Ch. 1 - For Problems 121124, evaluate the limit, using the...Ch. 1 - For Problems 121124, evaluate the limit, using the...Ch. 1 - For Problems 121124, evaluate the limit, using the...Ch. 1 - The notation limx0+ means that we only consider...Ch. 1 - Let limxf(x)= and limxg(x)=. Give possible...Ch. 1 - (a) Evaluate the limit limx0(x1x). (b) Explain why...Ch. 1 - For the functions in Problems 128135, do the...Ch. 1 - For the functions in Problems 128135, do the...Ch. 1 - For the functions in Problems 128135, do the...Ch. 1 - For the functions in Problems 128135, do the...Ch. 1 - For the functions in Problems 128135, do the...Ch. 1 - For the functions in Problems 128135, do the...Ch. 1 - For the functions in Problems 128135, do the...Ch. 1 - For the functions in Problems 128135, do the...
Additional Math Textbook Solutions
Find more solutions based on key concepts
A categorical variable has three categories, with the following frequencies of occurrence: a. Compute the perce...
Basic Business Statistics, Student Value Edition
z Scores. In Exercises 5-8, express all z scores with two decimal places.
5. ATL Data Speeds For the Verizon ai...
Elementary Statistics (13th Edition)
Finding Regions of Integration and Double Integrals
In Exercises 19-24, sketch the region of integration and ev...
University Calculus: Early Transcendentals (4th Edition)
Definite integrals Evaluate the following definite integrals. 35. 1e2x2lnxdx
Calculus: Early Transcendentals (2nd Edition)
Knowledge Booster


Learn more about
Need a deep-dive on the concept behind this application? Look no further. Learn more about this topic, calculus and related others by exploring similar questions and additional content below.Similar questions
- Determine whether the lines L₁ : F(t) = (−2, 3, −1)t + (0,2,-3) and L2 : ƒ(s) = (2, −3, 1)s + (−10, 17, -8) intersect. If they do, find the point of intersection. ● They intersect at the point They are skew lines They are parallel or equalarrow_forwardAnswer questions 2arrow_forwardHow does a fourier transform works?arrow_forward
- Determine the radius of convergence of a power series:12.6.5, 12.6.6, 12.6.7, 12.6.8Hint: Use Theorem12.5.1 and root test, ratio test, integral testarrow_forwardCan you answer this question and give step by step and why and how to get it. Can you write it (numerical method)arrow_forwardCan you answer this question and give step by step and why and how to get it. Can you write it (numerical method)arrow_forward
- There are three options for investing $1150. The first earns 10% compounded annually, the second earns 10% compounded quarterly, and the third earns 10% compounded continuously. Find equations that model each investment growth and use a graphing utility to graph each model in the same viewing window over a 20-year period. Use the graph to determine which investment yields the highest return after 20 years. What are the differences in earnings among the three investment? STEP 1: The formula for compound interest is A = nt = P(1 + − − ) n², where n is the number of compoundings per year, t is the number of years, r is the interest rate, P is the principal, and A is the amount (balance) after t years. For continuous compounding, the formula reduces to A = Pert Find r and n for each model, and use these values to write A in terms of t for each case. Annual Model r=0.10 A = Y(t) = 1150 (1.10)* n = 1 Quarterly Model r = 0.10 n = 4 A = Q(t) = 1150(1.025) 4t Continuous Model r=0.10 A = C(t) =…arrow_forwardUse a graphing utility to find the point of intersection, if any, of the graphs of the functions. Round your result to three decimal places. (Enter NONE in any unused answer blanks.) y = 100e0.01x (x, y) = y = 11,250 ×arrow_forward5. For the function y-x³-3x²-1, use derivatives to: (a) determine the intervals of increase and decrease. (b) determine the local (relative) maxima and minima. (e) determine the intervals of concavity. (d) determine the points of inflection. (e) sketch the graph with the above information indicated on the graph.arrow_forward
- Can you solve this 2 question numerical methodarrow_forward1. Estimate the area under the graph of f(x)-25-x from x=0 to x=5 using 5 approximating rectangles Using: (A) right endpoints. (B) left endpoints.arrow_forward9. Use fundamental theorem of calculus to find the derivative d a) *dt sin(x) b)(x)√1-2 dtarrow_forward
arrow_back_ios
SEE MORE QUESTIONS
arrow_forward_ios
Recommended textbooks for you
 Algebra & Trigonometry with Analytic GeometryAlgebraISBN:9781133382119Author:SwokowskiPublisher:Cengage
 Functions and Change: A Modeling Approach to Coll...AlgebraISBN:9781337111348Author:Bruce Crauder, Benny Evans, Alan NoellPublisher:Cengage Learning
 Trigonometry (MindTap Course List)TrigonometryISBN:9781337278461Author:Ron LarsonPublisher:Cengage Learning
Algebra & Trigonometry with Analytic Geometry
Algebra
ISBN:9781133382119
Author:Swokowski
Publisher:Cengage
Functions and Change: A Modeling Approach to Coll...
Algebra
ISBN:9781337111348
Author:Bruce Crauder, Benny Evans, Alan Noell
Publisher:Cengage Learning
Trigonometry (MindTap Course List)
Trigonometry
ISBN:9781337278461
Author:Ron Larson
Publisher:Cengage Learning
Hypothesis Testing - Solving Problems With Proportions; Author: The Organic Chemistry Tutor;https://www.youtube.com/watch?v=76VruarGn2Q;License: Standard YouTube License, CC-BY
Hypothesis Testing and Confidence Intervals (FRM Part 1 – Book 2 – Chapter 5); Author: Analystprep;https://www.youtube.com/watch?v=vth3yZIUlGQ;License: Standard YouTube License, CC-BY