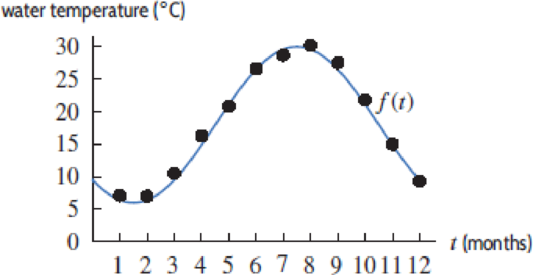
For Problems 50–53, use Figure 1.75 to estimate the given value for

Figure 1.75
B
Want to see the full answer?
Check out a sample textbook solution
Chapter 1 Solutions
Calculus: Single And Multivariable
Additional Math Textbook Solutions
Calculus Early Transcendentals, Binder Ready Version
University Calculus: Early Transcendentals (4th Edition)
Glencoe Math Accelerated, Student Edition
Precalculus: Mathematics for Calculus (Standalone Book)
Precalculus Enhanced with Graphing Utilities
- 4. A lighthouse is located 40 meters off-shore. The beam of light from the lighthouse rotates at a rate of 2 revolutions per minute clockwise. The beam hits a cliff on the beach 60 meters away, producing a dot of light that moves horizontally along this cliff. Let be the angle between the beam and the line through the searchlight perpendicular to the cliff. Use a trig function for the relationship. T a. How fast is this light moving along the beach when = if the beam is moving toward the h 3 perpendicular line? (remember you need radians for trig functions and their derivatives) b. How fast is this beam moving when I if the dot is moving away from the perpendicular 13 line? (Adjust picture to have light beam on other side of the vertical) beach/cliff CALCECCO 60m Lighthousearrow_forwardA hot-air balloon is released at 1:00 P.M. and rises vertically at a rate of 6 m/sec. An observation point is situated 100 meters from a point on the ground directly below the balloon (see the figure). If t denotes the time (in seconds) after 1:00 P.M., use an equation to express the distance d between the balloon and the observation point in terms of t.arrow_forward3. Sketch a graph of the data and answer the questions Date 9/18/21 9/18 9/19 9/19 9/19 time 2 pm 4 pm 10 am 1 pm 6 pm temperature 150° 140° 115° 125° 123° a. Find the average rate of change for the function between t = 2 pm and t = 4 pm on 9/18. b. Find the average rate of change for the function between 10 am and 6 pm on 9/19.arrow_forward
- Determine each of the following areas and show these graphically. 1. above z = 1.46 2. below z = -0.58 ww m 3. between z = -0.92 and z = 1.75arrow_forward(b) Using clearly written arrows, indicate on each figure which grid curves correspond to u being held constant, and which grid curves correspond to v being held constant. Write "u constant" and "v constant". 10 05 200 -as -1.0 FIGURE 1. FIGURE 2. 0.5 -1.0 FIGURE 3. FIGURE 4.arrow_forward18. A Ferris wheel has a radius of 7m. The centre of the wheel is 8m above the ground. The ferris wheel rotates at a constant speed of 15%/s. There is only one red seat on the ferris where. a. Graph one rotation below b. Determine an equation of a sine function which describes the height of the red seat where h is the height in metres and t is the time in secondsarrow_forward
- The height of a buoy on a lake is changing during a storm. The height's rate of change can be modeled by r(t) = 0.5 cos(0.2t) feet per second where t is measured in seconds. Is the buoy's height increasing or decreasing at time t = 10 seconds? Why?arrow_forward3. Find the total shaded area, given that r = 1.4 inches, 6 = 288°, and the small circles (Pac- dots) have radius 0.22 in. Express your answers both as a function of a and as a number rounded to 2 decimal places. Include units with both answers.arrow_forward1. The electric resistance R of a wire varies directly as its length Land inversely as its cross-sectional area A. Find the relation between resistance, length and area for a wire that has a resistance of 0.180 2 for a length of 52.0 m and cross-sectional area of 0.00670 cm2. (4 marks)arrow_forward
- The voltage for alternating current is modeled by the function V(t) : minimum voltage for this model? 231 cos(100at) where tis measured in seconds. What is the %3Darrow_forwardThe musical note E can be modeled by the function, y = asin(1320πx), where a = 1 and x is the time in seconds. Playing note E on your computer, you notice that it is not loud enough to be heard across the room. What change can you make to the function to make note E louder than the original?arrow_forwardDate: Name: UNIT 4• DESCRIPTIVE STATISTICS Lesson 2: Working with Two Categorical and Quantitative Variables Practice 4.2.2: Solving Problems Given Functions Fitted to Data Racecar tracks vary in length. A racecar driver records the time it takes him to circle various tracks once at top speed. The distance of the track and his time to circle each track once are listed in the following table. Use the data for problems 1–5. Time in minutes Track length in miles 0.42 1.5 0.15 0.53 0.42 1.5 0.43 1.4 0.82 • 2.5 0.31 1 0.56 2 0.26 0.9 0.15 0.5 0.75 2.7 1. Create a scatter plot of the data set. 2. Would a linear or exponential function be a better estimate for the data? Explain. 3. Which function is a better fit for the data: y = 2.3x or y = 3.3x? Use a graph to support your answer. 4. Approximately how long would it take the driver to circle a track that is 1.8 miles long? 5. It takes the driver 0.6 minutes to circle a track. Approximately how long is the track? continued SWB p. 65; SRB…arrow_forward
- Algebra & Trigonometry with Analytic GeometryAlgebraISBN:9781133382119Author:SwokowskiPublisher:Cengage
