
Concept explainers
Videos
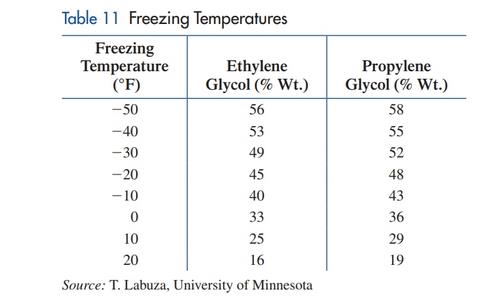
Freezing temperature. Ethylene glycol and propylene glycol are liquids used in antifreeze and deicing solutions. Ethylene glycol is listed as a hazardous chemical by the Environmental Protection Agency, while propylene glycol is generally regarded as safe. Table 11 lists the freezing temperature for various concentrations (as a percentage of total weight) of each chemical in a solution used to deice airplanes. A linear regression model for the ethylene glycol data in Table 11 is
where
(A) Draw a
(B) Use the model to estimate the freezing temperature to the nearest degree of a solution that
is 30% ethylene glycol.
(C) Use the model to estimate the percentage of ethylene glycol in a solution that freezes at
15°F.
Want to see the full answer?
Check out a sample textbook solution
Chapter 1 Solutions
Finite Mathematics for Business, Economics, Life Sciences and Social Sciences
Additional Math Textbook Solutions
Calculus for Business, Economics, Life Sciences, and Social Sciences (13th Edition)
Fundamentals of Differential Equations and Boundary Value Problems
Excursions in Modern Mathematics (9th Edition)
Calculus Volume 2
Thinking Mathematically (6th Edition)
Using and Understanding Mathematics: A Quantitative Reasoning Approach (6th Edition)


- Life Expectancy The following table shows the average life expectancy, in years, of a child born in the given year42 Life expectancy 2005 77.6 2007 78.1 2009 78.5 2011 78.7 2013 78.8 a. Find the equation of the regression line, and explain the meaning of its slope. b. Plot the data points and the regression line. c. Explain in practical terms the meaning of the slope of the regression line. d. Based on the trend of the regression line, what do you predict as the life expectancy of a child born in 2019? e. Based on the trend of the regression line, what do you predict as the life expectancy of a child born in 1580?2300arrow_forwardDemand for Candy Bars In this problem you will determine a linear demand equation that describes the demand for candy bars in your class. Survey your classmates to determine what price they would be willing to pay for a candy bar. Your survey form might look like the sample to the left. a Make a table of the number of respondents who answered yes at each price level. b Make a scatter plot of your data. c Find and graph the regression line y=mp+b, which gives the number of respondents y who would buy a candy bar if the price were p cents. This is the demand equation. Why is the slope m negative? d What is the p-intercept of the demand equation? What does this intercept tell you about pricing candy bars? Would you buy a candy bar from the vending machine in the hallway if the price is as indicated. Price Yes or No 50 75 1.00 1.25 1.50 1.75 2.00arrow_forwardA study was conducted to see if a person's income will affect their well-being. We want to create a model with Y = well-being index, and X = income in $1,000. The dependent variable in this study is: Income in $1,000 Well-being index Neitherarrow_forward
- Turbid water is muddy or cloudy water. Sunlight is necessary for most life forms; thus turbid water is considered a threat to wetland ecosystems. Passive filtration systems are commonly used to reduce turbidity in wetlands. Suspended solids are measured in mg/l. Is there a relation between input and output turbidity for a passive filtration system and, if so, is it statistically significant? At a wetlands environment in Illinois, the inlet and outlet turbidity of a passive filtration system have been measured. A random sample of measurements are shown below. (Reference: EPA Wetland Case Studies.) Reading Inlet (mg/l) Outlet (mg/l) 3 4 5 6 7 8 9 10 11 12 31.6 86.9 87.0 12.0 45.4 43.3 32.3 77.7 71.7 85.9 64.9 80.1 3.3 14.2 16.8 5.7 4.6 6.2 3.4 7.7 8.0 7.4 8.7 14.3 Use a 1% level of significance to test the claim that there is a monotone relationship (either way) between the ranks of the inlet readings and outlet readings. (a) Rank-order the inlet readings using 1 as the largest data…arrow_forwardTurbid water is muddy or cloudy water. Sunlight is necessary for most life forms; thus turbid water is considered a threat to wetland ecosystems. Passive filtration systems are commonly used to reduce turbidity in wetlands. Suspended solids are measured in mg/l. Is there a relation between input and output turbidity for a passive filtration system and, if so, is it statistically significant? At a wetlands environment in Illinois, the inlet and outlet turbidity of a passive filtration system have been measured. A random sample of measurements are shown below. (Reference: EPA Wetland Case Studies.) Reading 1 2 3 4 5 6 7 8 9 10 11 12 Inlet (mg/l) 59.1 25.7 70.5 71.0 37.6 43.5 13.1 24.2 16.7 49.1 67.6 31.7 Outlet (mg/l) 18.2 14.3 15.3 17.5 13.1 8.0 4.1 4.4 4.3 5.8 16.3 7.1 Use a 1% level of significance to test the claim that there is a monotone relationship (either way) between the ranks of the inlet readings and outlet readings. (a) Rank-order the inlet readings using 1 as…arrow_forwardTurbid water is muddy or cloudy water. Sunlight is necessary for most life forms; thus turbid water is considered a threat to wetland ecosystems. Passive filtration systems are commonly used to reduce turbidity in wetlands. Suspended solids are measured in mg/l. Is there a relation between input and output turbidity for a passive filtration system and, if so, is it statistically significant? At a wetlands environment in Illinois, the inlet and outlet turbidity of a passive filtration system have been measured. A random sample of measurements are shown below. (Reference: EPA Wetland Case Studies.) Reading 1 2 3 4 5 6 7 8 9 10 11 12 Inlet (mg/l) 62.1 13.8 63.5 30.6 91.1 11.5 67.2 75.6 79.3 29.5 72.9 21.3 Outlet (mg/l) 11.3 2.7 7.5 12.3 12.9 3.8 13.3 13.2 15.1 6.0 7.0 4.7 Use a 1% level of significance to test the claim that there is a monotone relationship (either way) between the ranks of the inlet readings and outlet readings. (a) Rank-order the inlet readings using 1 as…arrow_forward
- Turbid water is muddy or cloudy water. Sunlight is necessary for most life forms; thus turbid water is considered a threat to wetland ecosystems. Passive filtration systems are commonly used to reduce turbidity in wetlands. Suspended solids are measured in mg/l. Is there a relation between input and output turbidity for a passive filtration system and, if so, is it statistically significant? At a wetlands environment in Illinois, the inlet and outlet turbidity of a passive filtration system have been measured. A random sample of measurements are shown below. (Reference: EPA Wetland Case Studies.) Use a 1% level of significance to test the claim that there is a monotone relationship (either way) between the ranks of the inlet readings and outlet readings. (a) Rank-order the inlet readings using 1 as the largest data value. Also rank-order the outlet readings using 1 as the largest data value. Then construct a table of ranks to be used for a Spearman rank correlation test. (c) Compute…arrow_forwardAssume we have data demonstrating a strong linear link between the amount of fertilizer applied to certain plants and their yield. Which is the independent variable in this research question?arrow_forwardThe table contains price-supply data and price-demand data for com. Find a linear regression model for the price-supply data where x is supply (in billions of bushels) and y is price (in dollars) Do the same for the price-demand data. Find the equilibrium price for com Price ($/bu) 2.15 2.25 2.35 2.48 2.44 2.52 Supply (billion bu) 6.46 7.41 7:51 7.86 8.09 8.35 Price ($/bu) 2.06 2.12 2.22 2.39 2.32 2.42 Demand (billion bu) 9.92 9.28 8:34 8.04 7.86 6.93 4 Find a linear regression model for the price-supply data where x is supply (in billions of bushels) and y is price (in dollars) Y-0 (Type an equation using x as the variable Round to two decimal places as needed)arrow_forward
- A study examined the eating habits of 20 children at a nursery school. The variables measured for each child included: calories (the number of calories eaten at lunch), time (the time in minutes spent eating lunch), and sex (male=1, female=0). A multiple linear regression model using Y = calories, X1 = time, and X2 = sex led to the following model: y=547.65-2.85x1+10.67x2 For two children who spend the same amount of time eating, one male and one female, which child is predicted to consume more calories and by how much?arrow_forwardThe production of wine is a multibillion-dollar worldwide industry. In an attempt to develop a model of wine quality as judged by wine experts, data was collected from red wine variants of a certain type of wine. A sample of 12 wines is given. Develop a simple linear regression model to predict wine quality, measured on a scale from 0 (very bad) to 10 (excellent), based on alcohol content (%). Complete parts (a) through (d) below. Click the icon to view the data of wine quality and alcohol content. a. Construct a scatter plot. Choose the correct graph below. A. O D. A 0 15 0 15 0 40 Alcohol Content (%) Alcohol Content (%) Alcohol Content (%) b. For these data, bo = 4.9 and b₁ = 0.2. Interpret the meaning of the slope, b₁, in this problem. Choose the correct answer below. X A. The slope, b₁, implies that for each increase of 1 wine quality rating, the alcohol content is expected to increase by the value of b₁, in percentages. B. The slope, b₁, implies that for each increase of alcohol…arrow_forwardThe production of wine is a multibillion-dollar worldwide industry. In an attempt to develop a model of wine quality as judged by wine experts, data was collected from red wine variants of a certain type of wine. A sample of 12 wines is given. Develop a simple linear regression model to predict wine quality, measured on a scale from 0 (very bad) to 10 (excellent), based on alcohol content (%). Complete parts (a) through (d) below. Click the icon to view the data of wine quality and alcohol content. a. Construct a scatter plot. Choose the correct graph below. 10- SPA 15 0 15 40 Alcohol Content (%) Alcohol Content (%) Alcohol Content (%) b. For these data, b = 4.9 and b₁ = 0.2. Interpret the meaning of the slope, b₁, in this problem. Choose the correct answer below. A. The slope, b₁, implies that for each increase of 1 wine quality rating, the alcohol content is expected to increase by the value of b₁, in percentages. B. The slope, b₁, implies that for each increase of alcohol percentage…arrow_forward
 Functions and Change: A Modeling Approach to Coll...AlgebraISBN:9781337111348Author:Bruce Crauder, Benny Evans, Alan NoellPublisher:Cengage Learning
 Algebra and Trigonometry (MindTap Course List)AlgebraISBN:9781305071742Author:James Stewart, Lothar Redlin, Saleem WatsonPublisher:Cengage Learning