
Concept explainers
Videos
To Find: The values of minimum, first quartile, median, third quartile, and maximum of each data set.
Answer to Problem 11MCQ
The value of the minimum of the data set (2) is
Explanation of Solution
Given information:
The value of Commute
Calculation:
Let us consider the data for the commute
Identify the minimum, first quartile, median, third quartile, and maximum of each data set (1). Then make a box and whisker plot.
Use two parts to given the answer: in first part identify the minimum, first quartile, median, third quartile, and maximum of each data set, and in the second part make a box and whisker plot.
Part I: use the following steps to identify minimum, first quartile, median, third quartile, and maximum of each data set given in (1).
Step 1: arrange the data in increasing order that is order from least to greatest.
Step 2: Find the minimum and maximum:
Minimum: The least number is data set is called the minimum. Therefore the minimum of the data set (2) is
Maximum: The greatest number in data set is called maximum. Therefore the maximum of the data set (2) is
Step 3: Find the median.
Median: The median is the middle value in the data set, when data values are arranged in order and it is represented by
Median:
Step 4: Find the first quartile and third quartile.
First Quartile: If the data set is divided into four equal parts, then the first quartile is the median of the lower half of the data and it is represented by
The median of the lower half of the data is
Therefore first quartile
Third Quartile: If the data set is divided in to four equal parts, then the third quartile is the median of the upper half of the data and it is represented by
The median of the upper half of the data is
Therefore, the value of Third quartile is
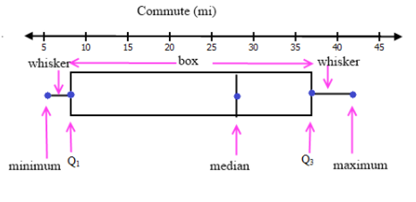
Part II: Make a box-and whisker plot for the data
A box-and −whisker plot is a graph that represented a set of data along a horizontal line. It consist three parts: a box, extended from first quartile to third quartile and has vertical line through median and two whiskers, the left whisker extended from minimum to first quartile and the right whisker extended from third quartile to the minimum.
Therefore, the box is;
Therefore, value of the minimum of the data set (2) is
Chapter 12 Solutions
High School Math 2015 Common Core Algebra 1 Student Edition Grade 8/9
Additional Math Textbook Solutions
Pre-Algebra Student Edition
Elementary Statistics: Picturing the World (7th Edition)
University Calculus: Early Transcendentals (4th Edition)
Calculus: Early Transcendentals (2nd Edition)
A Problem Solving Approach To Mathematics For Elementary School Teachers (13th Edition)
A First Course in Probability (10th Edition)


- Solve questions by Course Name (Ordinary Differential Equations II 2)arrow_forwardplease Solve questions by Course Name( Ordinary Differential Equations II 2)arrow_forwardInThe Northern Lights are bright flashes of colored light between 50 and 200 miles above Earth. Suppose a flash occurs 150 miles above Earth. What is the measure of arc BD, the portion of Earth from which the flash is visible? (Earth’s radius is approximately 4000 miles.)arrow_forward
- e). n! (n - 1)!arrow_forwardSuppose you flip a fair two-sided coin four times and record the result. a). List the sample space of this experiment. That is, list all possible outcomes that could occur when flipping a fair two-sided coin four total times. Assume the two sides of the coin are Heads (H) and Tails (T).arrow_forwarde). n! (n - 1)!arrow_forward
- Evaluate the following expression and show your work to support your calculations. a). 6! b). 4! 3!0! 7! c). 5!2! d). 5!2! e). n! (n - 1)!arrow_forwardAmy and Samiha have a hat that contains two playing cards, one ace and one king. They are playing a game where they randomly pick a card out of the hat four times, with replacement. Amy thinks that the probability of getting exactly two aces in four picks is equal to the probability of not getting exactly two aces in four picks. Samiha disagrees. She thinks that the probability of not getting exactly two aces is greater. The sample space of possible outcomes is listed below. A represents an ace, and K represents a king. Who is correct?arrow_forwardConsider the exponential function f(x) = 12x. Complete the sentences about the key features of the graph. The domain is all real numbers. The range is y> 0. The equation of the asymptote is y = 0 The y-intercept is 1arrow_forward
- The graph shows Alex's distance from home after biking for x hours. What is the average rate of change from -1 to 1 for the function? 4-2 о A. -2 О B. 2 О C. 1 O D. -1 ty 6 4 2 2 0 X 2 4arrow_forwardWrite 7. √49 using rational exponents. ○ A. 57 47 B. 7 O C. 47 ○ D. 74arrow_forwardCan you check If my short explantions make sense because I want to make sure that I describe this part accuratelyarrow_forward
 Algebra and Trigonometry (6th Edition)AlgebraISBN:9780134463216Author:Robert F. BlitzerPublisher:PEARSON
 Contemporary Abstract AlgebraAlgebraISBN:9781305657960Author:Joseph GallianPublisher:Cengage Learning
 Linear Algebra: A Modern IntroductionAlgebraISBN:9781285463247Author:David PoolePublisher:Cengage Learning
 Algebra And Trigonometry (11th Edition)AlgebraISBN:9780135163078Author:Michael SullivanPublisher:PEARSON
 Introduction to Linear Algebra, Fifth EditionAlgebraISBN:9780980232776Author:Gilbert StrangPublisher:Wellesley-Cambridge Press
 College Algebra (Collegiate Math)AlgebraISBN:9780077836344Author:Julie Miller, Donna GerkenPublisher:McGraw-Hill Education