
Concept explainers
Videos
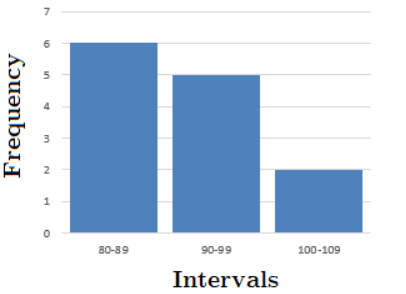
To find:the histogramthat represent the given data.
Answer to Problem 2P
Explanation of Solution
Given:
The given datashows battery life, in hours, for different brands of batteries.
Calculation:
As the given data is
Now, the data is first arranged in increasing order. Then,
The minimum data value is 80, and the maximum value is 105.
Divide the data in to three intervals.
Therefore, create a frequency table:
| Hours | Frequency |
| 6 | |
| 5 | |
| 2 |
Draw and level the axes. Draw a bar to represent the frequency of each interval.
The histogram for the given data is:

Chapter 12 Solutions
High School Math 2015 Common Core Algebra 1 Student Edition Grade 8/9
Additional Math Textbook Solutions
Calculus: Early Transcendentals (2nd Edition)
Elementary Statistics (13th Edition)
A First Course in Probability (10th Edition)
Thinking Mathematically (6th Edition)
Calculus: Early Transcendentals (2nd Edition)
Elementary Statistics


- 1) Express these large and small numbers from the Read and Study section in scientific notation: (a) 239,000 miles (b) 3,800,000,000,000 sheets of paper (c) 0.0000000000000000000000167 grams 2) Find all values for the variable x that make these equations true. (a) 5x = 1 (b) 3x = 1/1 9 (c) 4* = 11/ 4 (e) 4* = 64 (g) 10x = 1,000,000 (d) 3x=-3 (f) 2x = = 8 (h) 10x = 0.001arrow_forward(b) 4) Find an equation to fit each of the following graphs: (a) 20 20 18 16 14 12 10 8 6 4 2 24 22 20 18 16 14 12 10 8 16 A 2 -3 -2 -1-0 2 3 4. -1 0 1 2 3. -2 -2arrow_forward3) Which of the following are equivalent to 3? (There may be more than one that is equivalent!) -1 (a) (9)¯¹ 3. (b) (-3)-1 (c) (-3) -1 (d) -(¯3) (e) 11 3-1 (f) 3-4arrow_forward
- Given the following system of equations and its graph below, what can be determined about the slopes and y-intercepts of the system of equations? 7 y 6 5 4 3 2 -6-5-4-3-2-1 1+ -2 1 2 3 4 5 6 x + 2y = 8 2x + 4y = 12 The slopes are different, and the y-intercepts are different. The slopes are different, and the y-intercepts are the same. The slopes are the same, and the y-intercepts are different. O The slopes are the same, and the y-intercepts are the same.arrow_forwardChoose the function to match the graph. -2- 0 -7 -8 -9 --10- |--11- -12- f(x) = log x + 5 f(x) = log x - 5 f(x) = log (x+5) f(x) = log (x-5) 9 10 11 12 13 14arrow_forwardWhich of the following represents the graph of f(x)=3x-2? 7 6 5 4 ++ + + -7-6-5-4-3-2-1 1 2 3 4 5 6 7 -2 3 -5 6 -7 96 7 5 4 O++ -7-6-5-4-3-2-1 -2 -3 -4 -5 -7 765 432 -7-6-5-4-3-2-1 -2 ++ -3 -4 -5 -6 2 3 4 5 6 7 7 6 2 345 67 -7-6-5-4-3-2-1 2 3 4 5 67 4 -5arrow_forward
- 13) Let U = {j, k, l, m, n, o, p} be the universal set. Let V = {m, o,p), W = {l,o, k}, and X = {j,k). List the elements of the following sets and the cardinal number of each set. a) W° and n(W) b) (VUW) and n((V U W)') c) VUWUX and n(V U W UX) d) vnWnX and n(V WnX)arrow_forward9) Use the Venn Diagram given below to determine the number elements in each of the following sets. a) n(A). b) n(A° UBC). U B oh a k gy ท W z r e t ་ Carrow_forward10) Find n(K) given that n(T) = 7,n(KT) = 5,n(KUT) = 13.arrow_forward
 Algebra and Trigonometry (6th Edition)AlgebraISBN:9780134463216Author:Robert F. BlitzerPublisher:PEARSON
 Contemporary Abstract AlgebraAlgebraISBN:9781305657960Author:Joseph GallianPublisher:Cengage Learning
 Linear Algebra: A Modern IntroductionAlgebraISBN:9781285463247Author:David PoolePublisher:Cengage Learning
 Algebra And Trigonometry (11th Edition)AlgebraISBN:9780135163078Author:Michael SullivanPublisher:PEARSON
 Introduction to Linear Algebra, Fifth EditionAlgebraISBN:9780980232776Author:Gilbert StrangPublisher:Wellesley-Cambridge Press
 College Algebra (Collegiate Math)AlgebraISBN:9780077836344Author:Julie Miller, Donna GerkenPublisher:McGraw-Hill Education