
Fundamentals of Statistics (5th Edition)
5th Edition
ISBN: 9780134508306
Author: Michael Sullivan III
Publisher: PEARSON
expand_more
expand_more
format_list_bulleted
Concept explainers
Videos
Textbook Question
Chapter 12.2, Problem 14AYU
Celebrex Celebrex, a drug manufactured by Pfizer, Inc., is used to relieve symptoms associated with osteoarthritis and rheumatoid arthritis in adults. In clinical trials of the medication, some subjects reported dizziness as a side effect. The researchers wanted to discover whether the proportion of subjects taking Celebrex who reported dizziness as a side effect differed significantly from that for other treatment groups. The following data were collected.
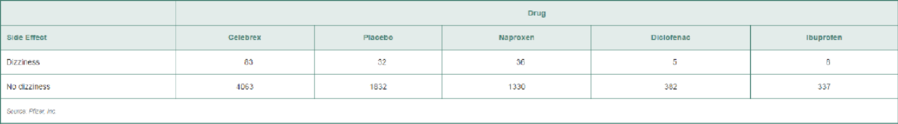
- a. Test whether the proportion of subjects within each treatment group who experienced dizziness are the same at the α = 0.01 level of significance.
- b. Construct a conditional distribution of side effect by treatment and draw a bar graph. Does this evidence support your conclusion in part (a)?
Expert Solution & Answer
Want to see the full answer?
Check out a sample textbook solution
Students have asked these similar questions
A poll before the elections showed that in a given sample 79% of people vote for candidate C. How many people should be interviewed so that the pollsters can be 99% sure that from 75% to 83% of the population will vote for candidate C? Round your answer to the whole number.
Suppose a random sample of 459 married couples found that 307 had two or more personality preferences in common. In another random sample of 471 married couples, it was found that only 31 had no preferences in common. Let p1 be the population proportion of all married couples who have two or more personality preferences in common. Let p2 be the population proportion of all married couples who have no personality preferences in common. Find a95% confidence interval for . Round your answer to three decimal places.
A history teacher interviewed a random sample of 80 students about their preferences in learning activities outside of school and whether they are considering watching a historical movie at the cinema. 69 answered that they would like to go to the cinema. Let p represent the proportion of students who want to watch a historical movie. Determine the maximal margin of error. Use α = 0.05. Round your answer to three decimal places.
Chapter 12 Solutions
Fundamentals of Statistics (5th Edition)
Ch. 12.1 - True or False: The shape of the chi-square...Ch. 12.1 - A _____ test is an inferential procedure used to...Ch. 12.1 - Suppose there are n independent trials of an...Ch. 12.1 - What are the two requirements that must be...Ch. 12.1 - In Problems 5 and 6, determine the expected counts...Ch. 12.1 - In Problems 5 and 6, determine the expected counts...Ch. 12.1 - Prob. 7AYUCh. 12.1 - Prob. 8AYUCh. 12.1 - In Problems 710, determine (a) the 2 test...Ch. 12.1 - In Problems 710, determine (a) the 2 test...
Ch. 12.1 - Applying the Concepts 11. NW Plain MMs According...Ch. 12.1 - Peanut MMs According to the manufacturer of MMs,...Ch. 12.1 - Prob. 13AYUCh. 12.1 - Prob. 14AYUCh. 12.1 - Always Wear a Helmet The National Highway Traffic...Ch. 12.1 - Religion in Congress Is the religious make-up of...Ch. 12.1 - Does It Matter Where I Sit? Does the location of...Ch. 12.1 - Racial Profiling On January 1, 2004, it became...Ch. 12.1 - Prob. 19AYUCh. 12.1 - Prob. 20AYUCh. 12.1 - Prob. 21AYUCh. 12.1 - Is the Die Loaded? A player in a craps game...Ch. 12.1 - Grade Distributions At Joliet Junior College, the...Ch. 12.1 - Population Shift An urban economist wonders if the...Ch. 12.1 - Prob. 25AYUCh. 12.1 - Living Alone? In 2000, 25.8% of Americans 15 years...Ch. 12.1 - Putting It Together: The V-2 Rocket in London In...Ch. 12.1 - Putting It Together: Weldons Dice On February 2,...Ch. 12.1 - Buying a New Car How much does the typical person...Ch. 12.1 - Why is goodness of fit a good choice for the title...Ch. 12.1 - Explain why chi-square goodness-of-fit tests are...Ch. 12.1 - Prob. 32AYUCh. 12.2 - True or False: The expected frequencies in a...Ch. 12.2 - In a chi-square test for ____ of proportions, we...Ch. 12.2 - The following table contains observed values and...Ch. 12.2 - The table in the next column contains observed...Ch. 12.2 - Prob. 5AYUCh. 12.2 - Prob. 6AYUCh. 12.2 - NW Family Structure and Sexual Activity A...Ch. 12.2 - Prenatal Care An obstetrician wants to learn...Ch. 12.2 - Health and Happiness Are health and happiness...Ch. 12.2 - Health and Education Does amount of education play...Ch. 12.2 - Social Well-Being and Obesity The Gallup...Ch. 12.2 - Profile of Smokers The following data represent...Ch. 12.2 - Efficacy of e-Cigs Do electronic cigarettes assist...Ch. 12.2 - Celebrex Celebrex, a drug manufactured by Pfizer,...Ch. 12.2 - NW Whats in a Word? In a recent survey conducted...Ch. 12.2 - Whats in a Word? Part II In a recent survey...Ch. 12.2 - Dropping a Course A survey was conducted at a...Ch. 12.2 - Prob. 18AYUCh. 12.2 - Prob. 19AYUCh. 12.2 - Prob. 20AYUCh. 12.2 - Putting It Together: Women, Aspirin, and Heart...Ch. 12.2 - Homeruns Go to...Ch. 12.2 - Explain the differences between the chi-square...Ch. 12.2 - Why does the test for homogeneity follow the same...Ch. 12.3 - Suppose a least-squares regression line is given...Ch. 12.3 - Prob. 2AYUCh. 12.3 - Prob. 3AYUCh. 12.3 - Prob. 4AYUCh. 12.3 - Prob. 5AYUCh. 12.3 - Prob. 6AYUCh. 12.3 - Prob. 7AYUCh. 12.3 - Prob. 8AYUCh. 12.3 - Prob. 9AYUCh. 12.3 - Prob. 10AYUCh. 12.3 - An Unhealthy Commute The following data represent...Ch. 12.3 - Credit Scores An economist wants to determine the...Ch. 12.3 - Height versus Head Circumference A pediatrician...Ch. 12.3 - Hurricanes The data in the next column represent...Ch. 12.3 - Concrete As concrete cures, it gains strength. The...Ch. 12.3 - Tar and Nicotine Every year the Federal Trade...Ch. 12.3 - Invest in Education Go to...Ch. 12.3 - American Black Bears In 1969, Dr. Michael R....Ch. 12.3 - CEO Performance (Refer to Problem 31 in Section...Ch. 12.3 - Bear Markets (Refer to Problem 32. Section 4.1) A...Ch. 12.3 - Age versus HDL Cholesterol A doctor wanted to...Ch. 12.3 - Prob. 22AYUCh. 12.3 - Influential Observations Zillow.com is a site that...Ch. 12.3 - Why is it important to perform graphical as well...Ch. 12.3 - Prob. 25AYUCh. 12.3 - Why is it desirable to have the explanatory...Ch. 12.4 - Intervals constructed about the predicted value of...Ch. 12.4 - Prob. 2AYUCh. 12.4 - Prob. 3AYUCh. 12.4 - Using the sample data from Problem 6 in Section...Ch. 12.4 - Prob. 5AYUCh. 12.4 - Prob. 6AYUCh. 12.4 - Prob. 7AYUCh. 12.4 - Prob. 8AYUCh. 12.4 - Prob. 9AYUCh. 12.4 - Prob. 10AYUCh. 12.4 - Prob. 11AYUCh. 12.4 - Tar and Nicotine Use the results of Problem 16 in...Ch. 12.4 - Prob. 13AYUCh. 12.4 - Prob. 14AYUCh. 12.4 - CEO Performance Use the results of Problem 19 from...Ch. 12.4 - Prob. 16AYUCh. 12.4 - Prob. 17AYUCh. 12 - Roulette Wheel A pit boss suspects that a roulette...Ch. 12 - Prob. 2RECh. 12 - Titanic With 20% of men, 74% of women, and 52% of...Ch. 12 - Prob. 4RECh. 12 - Prob. 5RECh. 12 - Prob. 6RECh. 12 - Seat Choice and GPA A biology professor wants to...Ch. 12 - Apartments The following data represent the square...Ch. 12 - Calories versus Sugar The following data represent...Ch. 12 - A pit boss is concerned that a pair of dice being...Ch. 12 - Prob. 2CTCh. 12 - The Harris Poll asked a random sample of adult...Ch. 12 - Prob. 4CTCh. 12 - Prob. 5CTCh. 12 - Prob. 6CTCh. 12 - Crickets make a chirping noise by sliding their...Ch. 12 - The following data represent the height (inches)...Ch. 12 - A researcher believes that as age increases, the...Ch. 12 - CASE STUDY Feeling Lucky? Well, Are You? In fiscal...
Knowledge Booster


Learn more about
Need a deep-dive on the concept behind this application? Look no further. Learn more about this topic, statistics and related others by exploring similar questions and additional content below.Similar questions
- A random sample of medical files is used to estimate the proportion p of all people who have blood type B. If you have no preliminary estimate for p, how many medical files should you include in a random sample in order to be 99% sure that the point estimate will be within a distance of 0.07 from p? Round your answer to the next higher whole number.arrow_forwardA clinical study is designed to assess the average length of hospital stay of patients who underwent surgery. A preliminary study of a random sample of 70 surgery patients’ records showed that the standard deviation of the lengths of stay of all surgery patients is 7.5 days. How large should a sample to estimate the desired mean to within 1 day at 95% confidence? Round your answer to the whole number.arrow_forwardA clinical study is designed to assess the average length of hospital stay of patients who underwent surgery. A preliminary study of a random sample of 70 surgery patients’ records showed that the standard deviation of the lengths of stay of all surgery patients is 7.5 days. How large should a sample to estimate the desired mean to within 1 day at 95% confidence? Round your answer to the whole number.arrow_forward
- In the experiment a sample of subjects is drawn of people who have an elbow surgery. Each of the people included in the sample was interviewed about their health status and measurements were taken before and after surgery. Are the measurements before and after the operation independent or dependent samples?arrow_forwardiid 1. The CLT provides an approximate sampling distribution for the arithmetic average Ỹ of a random sample Y₁, . . ., Yn f(y). The parameters of the approximate sampling distribution depend on the mean and variance of the underlying random variables (i.e., the population mean and variance). The approximation can be written to emphasize this, using the expec- tation and variance of one of the random variables in the sample instead of the parameters μ, 02: YNEY, · (1 (EY,, varyi n For the following population distributions f, write the approximate distribution of the sample mean. (a) Exponential with rate ẞ: f(y) = ß exp{−ßy} 1 (b) Chi-square with degrees of freedom: f(y) = ( 4 ) 2 y = exp { — ½/ } г( (c) Poisson with rate λ: P(Y = y) = exp(-\} > y! y²arrow_forward2. Let Y₁,……., Y be a random sample with common mean μ and common variance σ². Use the CLT to write an expression approximating the CDF P(Ỹ ≤ x) in terms of µ, σ² and n, and the standard normal CDF Fz(·).arrow_forward
- matharrow_forwardCompute the median of the following data. 32, 41, 36, 42, 29, 30, 40, 22, 25, 37arrow_forwardTask Description: Read the following case study and answer the questions that follow. Ella is a 9-year-old third-grade student in an inclusive classroom. She has been diagnosed with Emotional and Behavioural Disorder (EBD). She has been struggling academically and socially due to challenges related to self-regulation, impulsivity, and emotional outbursts. Ella's behaviour includes frequent tantrums, defiance toward authority figures, and difficulty forming positive relationships with peers. Despite her challenges, Ella shows an interest in art and creative activities and demonstrates strong verbal skills when calm. Describe 2 strategies that could be implemented that could help Ella regulate her emotions in class (4 marks) Explain 2 strategies that could improve Ella’s social skills (4 marks) Identify 2 accommodations that could be implemented to support Ella academic progress and provide a rationale for your recommendation.(6 marks) Provide a detailed explanation of 2 ways…arrow_forward
- Question 2: When John started his first job, his first end-of-year salary was $82,500. In the following years, he received salary raises as shown in the following table. Fill the Table: Fill the following table showing his end-of-year salary for each year. I have already provided the end-of-year salaries for the first three years. Calculate the end-of-year salaries for the remaining years using Excel. (If you Excel answer for the top 3 cells is not the same as the one in the following table, your formula / approach is incorrect) (2 points) Geometric Mean of Salary Raises: Calculate the geometric mean of the salary raises using the percentage figures provided in the second column named “% Raise”. (The geometric mean for this calculation should be nearly identical to the arithmetic mean. If your answer deviates significantly from the mean, it's likely incorrect. 2 points) Starting salary % Raise Raise Salary after raise 75000 10% 7500 82500 82500 4% 3300…arrow_forwardI need help with this problem and an explanation of the solution for the image described below. (Statistics: Engineering Probabilities)arrow_forwardI need help with this problem and an explanation of the solution for the image described below. (Statistics: Engineering Probabilities)arrow_forward
arrow_back_ios
SEE MORE QUESTIONS
arrow_forward_ios
Recommended textbooks for you
 Glencoe Algebra 1, Student Edition, 9780079039897...AlgebraISBN:9780079039897Author:CarterPublisher:McGraw Hill
 Big Ideas Math A Bridge To Success Algebra 1: Stu...AlgebraISBN:9781680331141Author:HOUGHTON MIFFLIN HARCOURTPublisher:Houghton Mifflin Harcourt
Glencoe Algebra 1, Student Edition, 9780079039897...
Algebra
ISBN:9780079039897
Author:Carter
Publisher:McGraw Hill
Big Ideas Math A Bridge To Success Algebra 1: Stu...
Algebra
ISBN:9781680331141
Author:HOUGHTON MIFFLIN HARCOURT
Publisher:Houghton Mifflin Harcourt
Correlation Vs Regression: Difference Between them with definition & Comparison Chart; Author: Key Differences;https://www.youtube.com/watch?v=Ou2QGSJVd0U;License: Standard YouTube License, CC-BY
Correlation and Regression: Concepts with Illustrative examples; Author: LEARN & APPLY : Lean and Six Sigma;https://www.youtube.com/watch?v=xTpHD5WLuoA;License: Standard YouTube License, CC-BY