
Elementary Statistics (13th Edition)
13th Edition
ISBN: 9780134462455
Author: Mario F. Triola
Publisher: PEARSON
expand_more
expand_more
format_list_bulleted
Videos
Textbook Question
Chapter 12.1, Problem 17BB
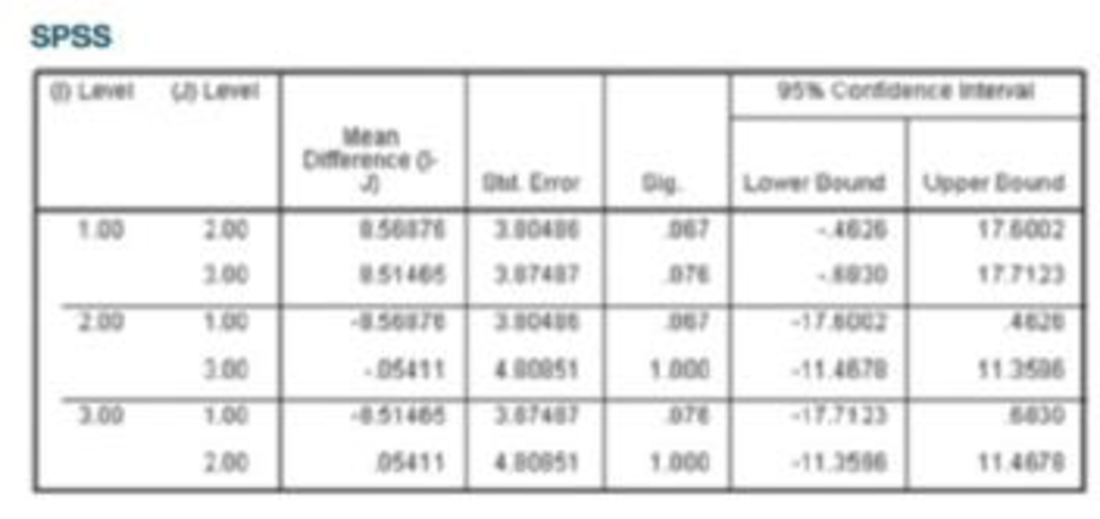
Tukey Test A display of the Bonferroni test results from Table 12-1 (which is part of the Chapter Problem) is provided on page 577. Shown on the top of the next page is the SPSS-generated display of results from the Tukey test using the same data. Compare the Tukey test results to those from the Bonferroni test.
Expert Solution & Answer
Want to see the full answer?
Check out a sample textbook solution
Students have asked these similar questions
Can you explain this statement below in layman's terms?
Secondary Analysis with Generalized Linear Mixed Model with clustering for Hospital Center and ICUvs Ward EnrolmentIn a secondary adjusted analysis we used generalized linear mixed models with random effects forcenter (a stratification variable in the primary analyses). In this analysis, the relative risk for the primaryoutcome of 90-day mortality for 7 versus 14 days of antibiotics was 0.90 (95% Confidence Interval [CI]0.78, 1.05).
In a crossover trial comparing a new drug to a standard, π denotes the probabilitythat the new one is judged better. It is desired to estimate π and test H0 : π = 0.5against H1 : π = 0.5. In 20 independent observations, the new drug is better eachtime.(a) Find and plot the likelihood function. Give the ML estimate of π (Hint: youmay use the plot function in R)
Can you explain what this analysis means in layman's terms?
- We calculated that a target sample size of 3626, which was based on anticipated baseline 90-day mortality of 22% and a noninferiority margin of no more than 4 percentage points, would give the trial 80% power, at a one-sided alpha level of 2.5%, accounting for a maximum of 5% loss to follow-up and for early stopping rules for three interim analyses.-
Chapter 12 Solutions
Elementary Statistics (13th Edition)
Ch. 12.1 - In Exercises 1-4, use the following listed arrival...Ch. 12.1 - In Exercises 1-4, use the following listed arrival...Ch. 12.1 - In Exercises 1-4, use the following listed arrival...Ch. 12.1 - In Exercises 1-4, use the following listed arrival...Ch. 12.1 - In Exercises 5-16, use analysis of variance for...Ch. 12.1 - In Exercises 5-16, use analysis of variance for...Ch. 12.1 - In Exercises 5-16, use analysis of variance for...Ch. 12.1 - In Exercises 5-16, use analysis of variance for...Ch. 12.1 - In Exercises 5-16, use analysis of variance for...Ch. 12.1 - Prob. 10BSC
Ch. 12.1 - Triathlon Times Jeff Parent is a statistics...Ch. 12.1 - Arsenic in Rice Listed below are amounts of...Ch. 12.1 - Prob. 13BSCCh. 12.1 - Speed Dating Listed below are attribute ratings of...Ch. 12.1 - In Exercises 15 and 16, use the data set in...Ch. 12.1 - In Exercises 15 and 16, use the data set in...Ch. 12.1 - Tukey Test A display of the Bonferroni test...Ch. 12.2 - Two-Way ANOVA The pulse rates in Table 12-3 from...Ch. 12.2 - Two-Way ANOVA If we have a goal of using the data...Ch. 12.2 - Interaction a. What is an interaction between two...Ch. 12.2 - Balanced Design Does the table given in Exercise 1...Ch. 12.2 - Pulse Rates If we use the data given in Exercise 1...Ch. 12.2 - Weights The weights (kg) in the following table...Ch. 12.2 - Heights The heights (cm) in the following table...Ch. 12.2 - Pancake Experiment Listed below are ratings of...Ch. 12.2 - Marathon Times Listed below are New York City...Ch. 12.2 - Smoking, Gender, and Body Temperature The table...Ch. 12.2 - Transformations of Data Example 1 illustrated the...Ch. 12 - Cola Weights Data Set 26 Cola Weights and Volumes...Ch. 12 - Cola Weights For the four samples described in...Ch. 12 - Cola Weights For the analysis of variance test...Ch. 12 - Cola Weights Identify the value of the test...Ch. 12 - Cola Weights The displayed results from Exercise 1...Ch. 12 - One-Way ANOVA In general, what is one-way analysis...Ch. 12 - One vs. Two What is the fundamental difference...Ch. 12 - Estimating Length Given below is a Minitab display...Ch. 12 - Estimating Length Using the same results displayed...Ch. 12 - Estimating Length Using the same results displayed...Ch. 12 - Speed Dating Data Set 18 Speed Dating in Appendix...Ch. 12 - Author Readability Pages were randomly selected by...Ch. 12 - Prob. 3RECh. 12 - Speed Dating Listed below are attribute ratings of...Ch. 12 - In Exercises 1-5, refer to the following list of...Ch. 12 - In Exercises 1-5, refer to the following list of...Ch. 12 - In Exercises 1-5, refer to the following list of...Ch. 12 - In Exercises 15, refer to the following list of...Ch. 12 - In Exercises 15, refer to the following list of...Ch. 12 - Quarters Assume that weights of quarters minted...Ch. 12 - Job Priority Survey USA Today reported on an...Ch. 12 - Win 4 Lottery Shown below is a histogram of digits...Ch. 12 - Does Weight Change with Age? Refer to Data Set 1...
Knowledge Booster


Learn more about
Need a deep-dive on the concept behind this application? Look no further. Learn more about this topic, statistics and related others by exploring similar questions and additional content below.Similar questions
- Can you help me understand this analysis? A 95.7% confidence interval is shown for the intention-to-treat analysis (accounting for alpha spending in interim analyses), and 95% confidence intervals are shown for the other two analyses. The widths of the confidence intervals have not been adjusted for multiplicity. The dashed line indicates the noninferiority margin of 4 percentage points.arrow_forwardTitle: Analyzing Customer Satisfaction for UnileverAs a member of Unilever's Customer Experience Management team, you are responsible forevaluating customer satisfaction levels and monitoring competitive moves. This case studyinvolves analyzing satisfaction data to test two key hypotheses about Unilever's performancerelative to its main competitor, Procter & Gamble (P&G).Unilever’s leadership team has emphasized the importance of customer satisfaction inmaintaining competitive advantage and market leadership. As part of this initiative, yourteam regularly monitors satisfaction scores and benchmarks them against competitors likeP&G.You are tasked with analyzing the provided dataset to answer the following questions:1. Does Unilever’s average customer satisfaction score meet the minimum threshold of2. 75%?Is there no significant difference between Unilever’s overall average satisfaction scoreand P&G’s average satisfaction score?arrow_forwardNeed help answering wuestionarrow_forward
- The following table shows a data set containing information for 25 of the shadow stocks tracked by the American Association of Individual Investors (aaii.com, February 2002). Shadow stocks are common stocks of smaller companies that are not closely followed by Wall Street analysts. Click on the datafile logo to reference the data. DATA file Company DeWolfe Companies Exchange Ticker Symbol Market Cap ($ millions) Price/ Gross Profit Earnings Ratio Margin (%) AMEX DWL 36.4 8.4 36.7 North Coast Energy OTC NCEB 52.5 6.2 59.3 Hansen Natural Corp. OTC HANS 41.1 14.6 44.8 MarineMax, Inc. NYSE HZO 111.5 7.2 23.8 Nanometrics Incorporated OTC NANO 228.6 38.0 53.3 TeamStaff, Inc. OTC TSTF 92.1 33.5 4.1 Environmental Tectonics AMEX ETC 51.1 35.8 35.9 Measurement Specialties AMEX MSS 101.8 26.8 37.6 SEMCO Energy, Inc. NYSE SEN 193.4 18.7 23.6 Party City Corporation OTC PCTY 97.2 15.9 36.4 Embrex, Inc. OTC EMBX 136.5 18.9 59.5 Tech/Ops Sevcon, Inc. AMEX ΤΟ 23.2 20.7 35.7 ARCADIS NV OTC ARCAF 173.4…arrow_forwardThe following table shows a data set containing information for 25 of the shadow stocks tracked by the American Association of Individual Investors (aaii.com, February 2002). Shadow stocks are common stocks of smaller companies that are not closely followed by Wall Street analysts. Click on the datafile logo to reference the data. DATA file Company DeWolfe Companies Exchange AMEX Ticker Symbol Market Cap Price/ Gross Profit Earnings Margin ($ millions) Ratio (%) DWL 36.4 8.4 36.7 North Coast Energy OTC NCEB 52.5 6.2 59.3 Hansen Natural Corp. OTC HANS 41.1 14.6 44.8 MarineMax, Inc. NYSE HZO 111.5 7.2 23.8 Nanometrics Incorporated OTC NANO 228.6 38.0 53.3 TeamStaff, Inc. OTC TSTF 92.1 33.5 4.1 Environmental Tectonics AMEX ETC 51.1 35.8 35.9 Measurement Specialties AMEX MSS 101.8 26.8 37.6 SEMCO Energy, Inc. NYSE SEN 193.4 18.7 23.6 Party City Corporation OTC PCTY 97.2 15.9 36.4 Embrex, Inc. OTC EMBX 136.5 18.9 59.5 Tech/Ops Sevcon, Inc. AMEX ΤΟ 23.2 20.7 35.7 ARCADIS NV OTC ARCAF 173.4…arrow_forwardThe following data show the year to date percent change (YTD % Change) for 30 stock-market indexes from around the word (The Wall Street Journal, August 26, 2013). a. What index has the largest positive YTD % Change? Round your answer to once decimal place. index with a YTD % Change of % b. Using a class width of 5 beginning with -20 and going to 40, develop a frequency distribution for the data. YTD % Change Frequency -20 - -15 -15 - -10 -10 - -5 -5 - 0 0 - 5 5 - 10 10 - 15 15 - 20 20 - 25 30 - 35 c. 1. 2. 3. 4.arrow_forward
- The following data show the year to date percent change (YTD % Change) for 30 stock-market indexes from around the word (The Wall Street Journal, August 26, 2013). Click on the datafile logo to reference the data. DATA file Country Australia Index S&P/ASX200 YTD % Change 10.2 Belgium Bel-20 12.6 Brazil São Paulo Bovespa -14.4 Canada S&P/TSX Comp 2.6 Chile Santiago IPSA -16.3 China Shanghai Composite -9.3 Eurozone EURO Stoxx 10.0 France CAC 40 11.8 Germany DAX 10.6 Hong Kong Hang Seng -3.5 India S&P BSE Sensex -4.7 Israel Tel Aviv 1.3 Italy FTSE MIB 6.6 Japan Nikkei 31.4 Mexico IPC All-Share -6.4 Netherlands AEX 9.3 Singapore Straits Times -2.5 South Korea Kospi -6.4 Spain IBEX 35 6.4 Sweden Switzerland SX All Share 13.8 Swiss Market 17.4 Taiwan Weighted 2.3 U.K. FTSE 100 10.1 U.S. S&P 500 16.6 U.S. DJIA 14.5 U.S. Dow Jones Utility 6.6 U.S. Nasdaq 100 17.4 U.S. Nasdaq Composite 21.1 World DJ Global ex U.S. 4.2 World DJ Global Index 9.9 a. What index has the largest positive YTD %…arrow_forwardDescribe a three step process you choose to determine how many elementary schools there are in the city of 5 million people.arrow_forwardQuiz: Exam 1 (Ch 1-4) z Scores Table-3.pdf x + edu/courses/308627/quizzes/2442507/take/questions/48957332 Canvas Hall It browser 5 Connect Set as default incorrect. • This exam is NOT resumable. Meaning, once you start the exam, you must complete it in its entirety. Any blank questions will be marked as By taking this exam, you agree to adhere to the academic integrity standards, which consist of NOT cheating in any way. To get the highest possible score, you are encouraged to review your notes before taking the exam. You may use your notes during the exam, but note that you should be familiar with the concepts and formulas before taking exam. z Scores Table.pdf Question 3 3 pts Here is a data from a survey asking young children how many hours they spend playing video games. The researchers reported the percent of boys and girls who played no games, less than 1 hour per day, 1-3 hours per day, or greater than 3 hours per day. The most common number of hours per day that boys played is…arrow_forward
- Write a Regression summary explaining significance of mode, explaining regression coefficients, significance of the independent variables, R and R square. Premiums earned Net income Dividends Underwriting Gain/ Loss 30.2 1.6 0.6 0.1 47.2 0.6 0.7 -3.6 92.8 8.4 1.8 -1.5 95.4 7.6 2 -4 100.4 6.3 2.2 -8.1 104.9 6.3 2.4 -10.8 113.2 2.2 2.3 -18.2 130.3 3.0 2.4 -21.4 161.9 13.5 2.3 -12.8 182.5 14.9 2.9 -5.9 193.3 11.7 2.9 -7.6arrow_forward1- Let A = {A1, A2, ...), in which A, A, = 0, when i j. a) Is A a π-system? If not, which element(s) should be added to A to become a π-system? b) Prove that σ(A) consists of the finite or countable unions of elements of A; i.c., A E σ(A) if and only if there exists finite or countable sequence {n} such that A = U₁An (Hint: Let F be such class; prove that F is a σ-filed containing A.) c) Let p ≥ 0 be a sequence of non-negative real numbers with Σip₁ = 1. Using p₁'s, how do you construct a probability measure on σ(A)? (Hint: use extension theorem.) 2- Construct an example for which P(lim sup A,) = 1 and P(lim inf An) = 0.arrow_forwardIn a town with 5000 adults, a sample of 50 is selected using SRSWOR and asked their opinion of a proposed municipal project; 30 are found to favor it and 20 oppose it. If, in fact, the adults of the town were equally divided on the proposal, what would be the probability of observing what has been observed? Approximate using the Binomial distribution. Compare this with the exact probability which is 0.0418.arrow_forward
arrow_back_ios
SEE MORE QUESTIONS
arrow_forward_ios
Recommended textbooks for you
 Linear Algebra: A Modern IntroductionAlgebraISBN:9781285463247Author:David PoolePublisher:Cengage Learning
 Algebra & Trigonometry with Analytic GeometryAlgebraISBN:9781133382119Author:SwokowskiPublisher:Cengage
 Holt Mcdougal Larson Pre-algebra: Student Edition...AlgebraISBN:9780547587776Author:HOLT MCDOUGALPublisher:HOLT MCDOUGAL
Linear Algebra: A Modern Introduction
Algebra
ISBN:9781285463247
Author:David Poole
Publisher:Cengage Learning
Algebra & Trigonometry with Analytic Geometry
Algebra
ISBN:9781133382119
Author:Swokowski
Publisher:Cengage
Holt Mcdougal Larson Pre-algebra: Student Edition...
Algebra
ISBN:9780547587776
Author:HOLT MCDOUGAL
Publisher:HOLT MCDOUGAL
Introduction to experimental design and analysis of variance (ANOVA); Author: Dr. Bharatendra Rai;https://www.youtube.com/watch?v=vSFo1MwLoxU;License: Standard YouTube License, CC-BY