
Elementary Statistics (13th Edition)
13th Edition
ISBN: 9780134462455
Author: Mario F. Triola
Publisher: PEARSON
expand_more
expand_more
format_list_bulleted
Videos
Textbook Question
Chapter 12.1, Problem 3BSC
In Exercises 1-4, use the following listed arrival delay times (minutes) for American Airline flights from New York to Los Angeles. Negative values correspond to flights that arrived early. Also shown are the SPSS results for analysis of variance. Assume that we plan to use a 0.05 significance level to test the claim that the different flights have the same mean arrival delay time.
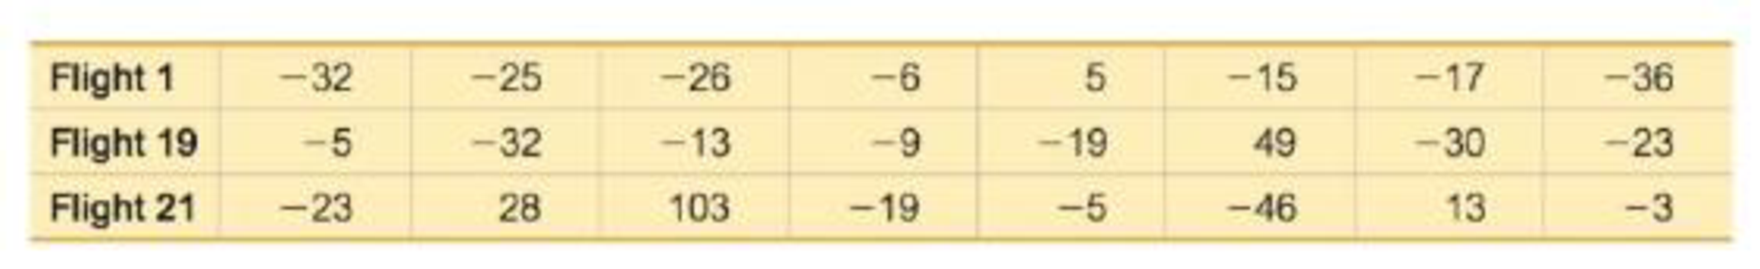
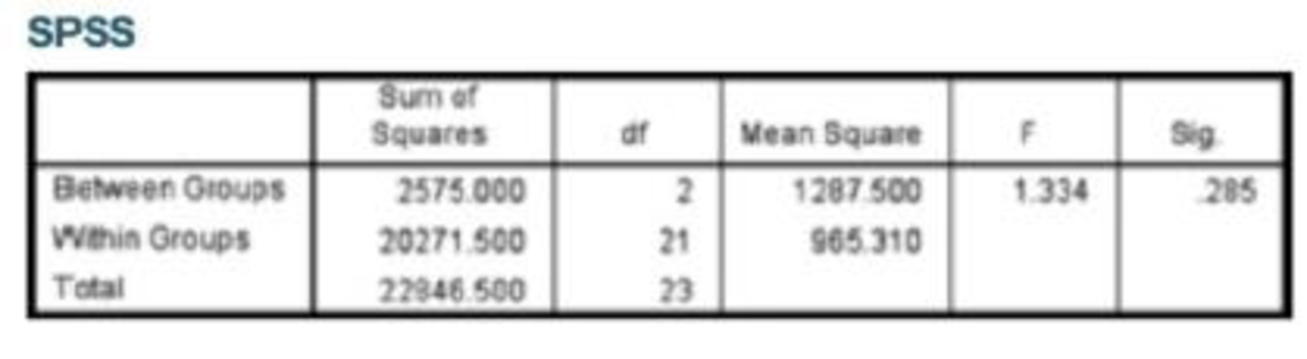
3. Test Statistic What is the value of the test statistic? What distribution is used with the test statistic?
Expert Solution & Answer
Want to see the full answer?
Check out a sample textbook solution
Students have asked these similar questions
Find the critical value for a left-tailed test using the F distribution with a 0.025, degrees of freedom in the numerator=12, and degrees of freedom in the
denominator = 50. A portion of the table of critical values of the F-distribution is provided.
Click the icon to view the partial table of critical values of the F-distribution.
What is the critical value?
(Round to two decimal places as needed.)
A retail store manager claims that the average daily sales of the store are $1,500.
You aim to test whether the actual average daily sales differ significantly from this claimed value.
You can provide your answer by inserting a text box and the answer must include:
Null hypothesis,
Alternative hypothesis,
Show answer (output table/summary table), and
Conclusion based on the P value.
Showing the calculation is a must. If calculation is missing,so please provide a step by step on the answers
Numerical answers in the yellow cells
Show all work
Chapter 12 Solutions
Elementary Statistics (13th Edition)
Ch. 12.1 - In Exercises 1-4, use the following listed arrival...Ch. 12.1 - In Exercises 1-4, use the following listed arrival...Ch. 12.1 - In Exercises 1-4, use the following listed arrival...Ch. 12.1 - In Exercises 1-4, use the following listed arrival...Ch. 12.1 - In Exercises 5-16, use analysis of variance for...Ch. 12.1 - In Exercises 5-16, use analysis of variance for...Ch. 12.1 - In Exercises 5-16, use analysis of variance for...Ch. 12.1 - In Exercises 5-16, use analysis of variance for...Ch. 12.1 - In Exercises 5-16, use analysis of variance for...Ch. 12.1 - Prob. 10BSC
Ch. 12.1 - Triathlon Times Jeff Parent is a statistics...Ch. 12.1 - Arsenic in Rice Listed below are amounts of...Ch. 12.1 - Prob. 13BSCCh. 12.1 - Speed Dating Listed below are attribute ratings of...Ch. 12.1 - In Exercises 15 and 16, use the data set in...Ch. 12.1 - In Exercises 15 and 16, use the data set in...Ch. 12.1 - Tukey Test A display of the Bonferroni test...Ch. 12.2 - Two-Way ANOVA The pulse rates in Table 12-3 from...Ch. 12.2 - Two-Way ANOVA If we have a goal of using the data...Ch. 12.2 - Interaction a. What is an interaction between two...Ch. 12.2 - Balanced Design Does the table given in Exercise 1...Ch. 12.2 - Pulse Rates If we use the data given in Exercise 1...Ch. 12.2 - Weights The weights (kg) in the following table...Ch. 12.2 - Heights The heights (cm) in the following table...Ch. 12.2 - Pancake Experiment Listed below are ratings of...Ch. 12.2 - Marathon Times Listed below are New York City...Ch. 12.2 - Smoking, Gender, and Body Temperature The table...Ch. 12.2 - Transformations of Data Example 1 illustrated the...Ch. 12 - Cola Weights Data Set 26 Cola Weights and Volumes...Ch. 12 - Cola Weights For the four samples described in...Ch. 12 - Cola Weights For the analysis of variance test...Ch. 12 - Cola Weights Identify the value of the test...Ch. 12 - Cola Weights The displayed results from Exercise 1...Ch. 12 - One-Way ANOVA In general, what is one-way analysis...Ch. 12 - One vs. Two What is the fundamental difference...Ch. 12 - Estimating Length Given below is a Minitab display...Ch. 12 - Estimating Length Using the same results displayed...Ch. 12 - Estimating Length Using the same results displayed...Ch. 12 - Speed Dating Data Set 18 Speed Dating in Appendix...Ch. 12 - Author Readability Pages were randomly selected by...Ch. 12 - Prob. 3RECh. 12 - Speed Dating Listed below are attribute ratings of...Ch. 12 - In Exercises 1-5, refer to the following list of...Ch. 12 - In Exercises 1-5, refer to the following list of...Ch. 12 - In Exercises 1-5, refer to the following list of...Ch. 12 - In Exercises 15, refer to the following list of...Ch. 12 - In Exercises 15, refer to the following list of...Ch. 12 - Quarters Assume that weights of quarters minted...Ch. 12 - Job Priority Survey USA Today reported on an...Ch. 12 - Win 4 Lottery Shown below is a histogram of digits...Ch. 12 - Does Weight Change with Age? Refer to Data Set 1...
Knowledge Booster


Learn more about
Need a deep-dive on the concept behind this application? Look no further. Learn more about this topic, statistics and related others by exploring similar questions and additional content below.Similar questions
- Show all workarrow_forwardplease find the answers for the yellows boxes using the information and the picture belowarrow_forwardA marketing agency wants to determine whether different advertising platforms generate significantly different levels of customer engagement. The agency measures the average number of daily clicks on ads for three platforms: Social Media, Search Engines, and Email Campaigns. The agency collects data on daily clicks for each platform over a 10-day period and wants to test whether there is a statistically significant difference in the mean number of daily clicks among these platforms. Conduct ANOVA test. You can provide your answer by inserting a text box and the answer must include: also please provide a step by on getting the answers in excel Null hypothesis, Alternative hypothesis, Show answer (output table/summary table), and Conclusion based on the P value.arrow_forward
- A company found that the daily sales revenue of its flagship product follows a normal distribution with a mean of $4500 and a standard deviation of $450. The company defines a "high-sales day" that is, any day with sales exceeding $4800. please provide a step by step on how to get the answers Q: What percentage of days can the company expect to have "high-sales days" or sales greater than $4800? Q: What is the sales revenue threshold for the bottom 10% of days? (please note that 10% refers to the probability/area under bell curve towards the lower tail of bell curve) Provide answers in the yellow cellsarrow_forwardBusiness Discussarrow_forwardThe following data represent total ventilation measured in liters of air per minute per square meter of body area for two independent (and randomly chosen) samples. Analyze these data using the appropriate non-parametric hypothesis testarrow_forward
arrow_back_ios
SEE MORE QUESTIONS
arrow_forward_ios
Recommended textbooks for you
 Glencoe Algebra 1, Student Edition, 9780079039897...AlgebraISBN:9780079039897Author:CarterPublisher:McGraw Hill
 Holt Mcdougal Larson Pre-algebra: Student Edition...AlgebraISBN:9780547587776Author:HOLT MCDOUGALPublisher:HOLT MCDOUGAL
Glencoe Algebra 1, Student Edition, 9780079039897...
Algebra
ISBN:9780079039897
Author:Carter
Publisher:McGraw Hill
Holt Mcdougal Larson Pre-algebra: Student Edition...
Algebra
ISBN:9780547587776
Author:HOLT MCDOUGAL
Publisher:HOLT MCDOUGAL
Introduction to experimental design and analysis of variance (ANOVA); Author: Dr. Bharatendra Rai;https://www.youtube.com/watch?v=vSFo1MwLoxU;License: Standard YouTube License, CC-BY