
Elementary Statistics (13th Edition)
13th Edition
ISBN: 9780134462455
Author: Mario F. Triola
Publisher: PEARSON
expand_more
expand_more
format_list_bulleted
Videos
Textbook Question
Chapter 12, Problem 2CRE
In Exercises 1-5, refer to the following list of departure delay times (min) of American Airline flights from JFK airport in New York to LAX airport in Los Angeles. Assume that the data are samples randomly selected from larger populations.
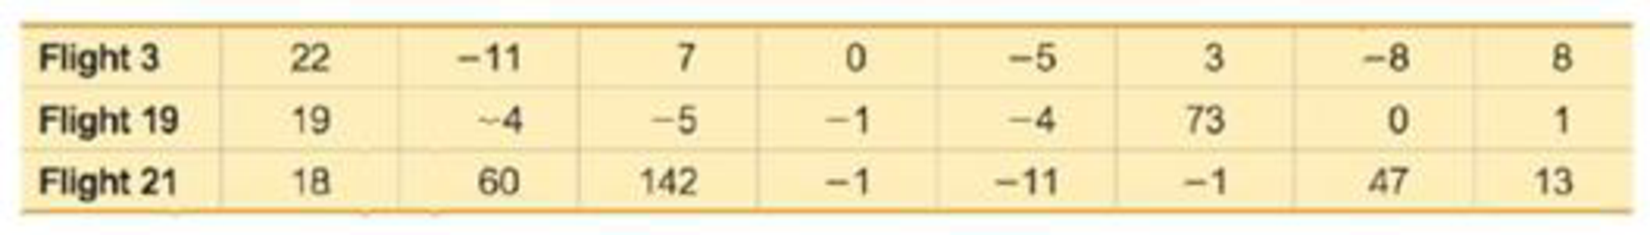
2. Comparing Two Means Treating the data as samples from larger populations, test the claim that there is a difference between the
Expert Solution & Answer
Want to see the full answer?
Check out a sample textbook solution
Students have asked these similar questions
08:34
◄ Classroom
07:59
Probs. 5-32/33
D
ا.
89
5-34. Determine the horizontal and vertical components
of reaction at the pin A and the normal force at the smooth
peg B on the member.
A
0,4 m
0.4 m
Prob. 5-34
F=600 N
fr
th
ar
0.
163586
5-37. The wooden plank resting between the buildings
deflects slightly when it supports the 50-kg boy. This
deflection causes a triangular distribution of load at its ends.
having maximum intensities of w, and wg. Determine w
and wg. each measured in N/m. when the boy is standing
3 m from one end as shown. Neglect the mass of the plank.
0.45 m
3 m
Examine the Variables: Carefully review and note the names of all variables in the dataset. Examples of these variables include:
Mileage (mpg)
Number of Cylinders (cyl)
Displacement (disp)
Horsepower (hp)
Research: Google to understand these variables.
Statistical Analysis: Select mpg variable, and perform the following statistical tests. Once you are done with these tests using mpg variable, repeat the same with hp
Mean
Median
First Quartile (Q1)
Second Quartile (Q2)
Third Quartile (Q3)
Fourth Quartile (Q4)
10th Percentile
70th Percentile
Skewness
Kurtosis
Document Your Results:
In RStudio: Before running each statistical test, provide a heading in the format shown at the bottom. “# Mean of mileage – Your name’s command”
In Microsoft Word: Once you've completed all tests, take a screenshot of your results in RStudio and paste it into a Microsoft Word document. Make sure that snapshots are very clear. You will need multiple snapshots. Also transfer these results to the…
Chapter 12 Solutions
Elementary Statistics (13th Edition)
Ch. 12.1 - In Exercises 1-4, use the following listed arrival...Ch. 12.1 - In Exercises 1-4, use the following listed arrival...Ch. 12.1 - In Exercises 1-4, use the following listed arrival...Ch. 12.1 - In Exercises 1-4, use the following listed arrival...Ch. 12.1 - In Exercises 5-16, use analysis of variance for...Ch. 12.1 - In Exercises 5-16, use analysis of variance for...Ch. 12.1 - In Exercises 5-16, use analysis of variance for...Ch. 12.1 - In Exercises 5-16, use analysis of variance for...Ch. 12.1 - In Exercises 5-16, use analysis of variance for...Ch. 12.1 - Prob. 10BSC
Ch. 12.1 - Triathlon Times Jeff Parent is a statistics...Ch. 12.1 - Arsenic in Rice Listed below are amounts of...Ch. 12.1 - Prob. 13BSCCh. 12.1 - Speed Dating Listed below are attribute ratings of...Ch. 12.1 - In Exercises 15 and 16, use the data set in...Ch. 12.1 - In Exercises 15 and 16, use the data set in...Ch. 12.1 - Tukey Test A display of the Bonferroni test...Ch. 12.2 - Two-Way ANOVA The pulse rates in Table 12-3 from...Ch. 12.2 - Two-Way ANOVA If we have a goal of using the data...Ch. 12.2 - Interaction a. What is an interaction between two...Ch. 12.2 - Balanced Design Does the table given in Exercise 1...Ch. 12.2 - Pulse Rates If we use the data given in Exercise 1...Ch. 12.2 - Weights The weights (kg) in the following table...Ch. 12.2 - Heights The heights (cm) in the following table...Ch. 12.2 - Pancake Experiment Listed below are ratings of...Ch. 12.2 - Marathon Times Listed below are New York City...Ch. 12.2 - Smoking, Gender, and Body Temperature The table...Ch. 12.2 - Transformations of Data Example 1 illustrated the...Ch. 12 - Cola Weights Data Set 26 Cola Weights and Volumes...Ch. 12 - Cola Weights For the four samples described in...Ch. 12 - Cola Weights For the analysis of variance test...Ch. 12 - Cola Weights Identify the value of the test...Ch. 12 - Cola Weights The displayed results from Exercise 1...Ch. 12 - One-Way ANOVA In general, what is one-way analysis...Ch. 12 - One vs. Two What is the fundamental difference...Ch. 12 - Estimating Length Given below is a Minitab display...Ch. 12 - Estimating Length Using the same results displayed...Ch. 12 - Estimating Length Using the same results displayed...Ch. 12 - Speed Dating Data Set 18 Speed Dating in Appendix...Ch. 12 - Author Readability Pages were randomly selected by...Ch. 12 - Prob. 3RECh. 12 - Speed Dating Listed below are attribute ratings of...Ch. 12 - In Exercises 1-5, refer to the following list of...Ch. 12 - In Exercises 1-5, refer to the following list of...Ch. 12 - In Exercises 1-5, refer to the following list of...Ch. 12 - In Exercises 15, refer to the following list of...Ch. 12 - In Exercises 15, refer to the following list of...Ch. 12 - Quarters Assume that weights of quarters minted...Ch. 12 - Job Priority Survey USA Today reported on an...Ch. 12 - Win 4 Lottery Shown below is a histogram of digits...Ch. 12 - Does Weight Change with Age? Refer to Data Set 1...
Knowledge Booster


Learn more about
Need a deep-dive on the concept behind this application? Look no further. Learn more about this topic, statistics and related others by exploring similar questions and additional content below.Similar questions
- Examine the Variables: Carefully review and note the names of all variables in the dataset. Examples of these variables include: Mileage (mpg) Number of Cylinders (cyl) Displacement (disp) Horsepower (hp) Research: Google to understand these variables. Statistical Analysis: Select mpg variable, and perform the following statistical tests. Once you are done with these tests using mpg variable, repeat the same with hp Mean Median First Quartile (Q1) Second Quartile (Q2) Third Quartile (Q3) Fourth Quartile (Q4) 10th Percentile 70th Percentile Skewness Kurtosis Document Your Results: In RStudio: Before running each statistical test, provide a heading in the format shown at the bottom. “# Mean of mileage – Your name’s command” In Microsoft Word: Once you've completed all tests, take a screenshot of your results in RStudio and paste it into a Microsoft Word document. Make sure that snapshots are very clear. You will need multiple snapshots. Also transfer these results to the…arrow_forward2 (VaR and ES) Suppose X1 are independent. Prove that ~ Unif[-0.5, 0.5] and X2 VaRa (X1X2) < VaRa(X1) + VaRa (X2). ~ Unif[-0.5, 0.5]arrow_forward8 (Correlation and Diversification) Assume we have two stocks, A and B, show that a particular combination of the two stocks produce a risk-free portfolio when the correlation between the return of A and B is -1.arrow_forward
- 9 (Portfolio allocation) Suppose R₁ and R2 are returns of 2 assets and with expected return and variance respectively r₁ and 72 and variance-covariance σ2, 0%½ and σ12. Find −∞ ≤ w ≤ ∞ such that the portfolio wR₁ + (1 - w) R₂ has the smallest risk.arrow_forward7 (Multivariate random variable) Suppose X, €1, €2, €3 are IID N(0, 1) and Y2 Y₁ = 0.2 0.8X + €1, Y₂ = 0.3 +0.7X+ €2, Y3 = 0.2 + 0.9X + €3. = (In models like this, X is called the common factors of Y₁, Y₂, Y3.) Y = (Y1, Y2, Y3). (a) Find E(Y) and cov(Y). (b) What can you observe from cov(Y). Writearrow_forward1 (VaR and ES) Suppose X ~ f(x) with 1+x, if 0> x > −1 f(x) = 1−x if 1 x > 0 Find VaRo.05 (X) and ES0.05 (X).arrow_forward
- Joy is making Christmas gifts. She has 6 1/12 feet of yarn and will need 4 1/4 to complete our project. How much yarn will she have left over compute this solution in two different ways arrow_forwardSolve for X. Explain each step. 2^2x • 2^-4=8arrow_forwardOne hundred people were surveyed, and one question pertained to their educational background. The results of this question and their genders are given in the following table. Female (F) Male (F′) Total College degree (D) 30 20 50 No college degree (D′) 30 20 50 Total 60 40 100 If a person is selected at random from those surveyed, find the probability of each of the following events.1. The person is female or has a college degree. Answer: equation editor Equation Editor 2. The person is male or does not have a college degree. Answer: equation editor Equation Editor 3. The person is female or does not have a college degree.arrow_forward
arrow_back_ios
SEE MORE QUESTIONS
arrow_forward_ios
Recommended textbooks for you
 Glencoe Algebra 1, Student Edition, 9780079039897...AlgebraISBN:9780079039897Author:CarterPublisher:McGraw Hill
 Holt Mcdougal Larson Pre-algebra: Student Edition...AlgebraISBN:9780547587776Author:HOLT MCDOUGALPublisher:HOLT MCDOUGAL
 Big Ideas Math A Bridge To Success Algebra 1: Stu...AlgebraISBN:9781680331141Author:HOUGHTON MIFFLIN HARCOURTPublisher:Houghton Mifflin Harcourt
 College Algebra (MindTap Course List)AlgebraISBN:9781305652231Author:R. David Gustafson, Jeff HughesPublisher:Cengage Learning
Glencoe Algebra 1, Student Edition, 9780079039897...
Algebra
ISBN:9780079039897
Author:Carter
Publisher:McGraw Hill
Holt Mcdougal Larson Pre-algebra: Student Edition...
Algebra
ISBN:9780547587776
Author:HOLT MCDOUGAL
Publisher:HOLT MCDOUGAL
Big Ideas Math A Bridge To Success Algebra 1: Stu...
Algebra
ISBN:9781680331141
Author:HOUGHTON MIFFLIN HARCOURT
Publisher:Houghton Mifflin Harcourt
College Algebra (MindTap Course List)
Algebra
ISBN:9781305652231
Author:R. David Gustafson, Jeff Hughes
Publisher:Cengage Learning
Hypothesis Testing using Confidence Interval Approach; Author: BUM2413 Applied Statistics UMP;https://www.youtube.com/watch?v=Hq1l3e9pLyY;License: Standard YouTube License, CC-BY
Hypothesis Testing - Difference of Two Means - Student's -Distribution & Normal Distribution; Author: The Organic Chemistry Tutor;https://www.youtube.com/watch?v=UcZwyzwWU7o;License: Standard Youtube License