Videos
Find the slope the tangent of line and graph at given point.
Answer to Problem 56RE
Slope of about
Explanation of Solution
Given:
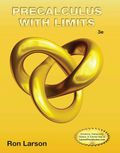
Consider the following function
To draw graph the function
The following Maple commands will produce the graph of the function
Now, visually approximate the slope of the graph of the function
Because a tangent line approximates the slope of the graph at a point, the slope of the graph of
From the graph, the tangent line at (2,2) rises approximately two units for each eight-unit
change in
Because the tangent line at the point (2,2) has a slope of about
Chapter 12 Solutions
EBK PRECALCULUS W/LIMITS


- Suppose the number of people who register to attend the Tucson Festival of Books can be modeled by P(t) = k(1.1), where t is the number of days since the registration window opened. Assume k is a positive constant. Which of the following represents how long it will take in days for the number of people who register to double? t = In(1.1) In(2) In(2) t = In(1.1) In(1.1) t = t = t = In(2) - In(k) In(2) In(k) + In(1.1) In(2) - In(k) In(1.1)arrow_forwardUse the method of washers to find the volume of the solid that is obtained when the region between the graphs f(x) = √√2 and g(x) = secx over the interval ≤x≤ is rotated about the x-axis.arrow_forward5 Use the method of disks to find the volume of the solid that is obtained when the region under the curve y = over the interval [4,17] is rotated about the x-axis.arrow_forward
- 3. Use the method of washers to find the volume of the solid that is obtained when the region between the graphs f(x) = √√2 and g(x) = secx over the interval ≤x≤ is rotated about the x-axis.arrow_forward4. Use cylindrical shells to find the volume of the solid generated when the region enclosed by the given curves is revolved about the x-axis. y = √√x, y = 0, y = √√3arrow_forward5 4 3 21 N -5-4-3-2 -1 -2 -3 -4 1 2 3 4 5 -5+ Write an equation for the function graphed above y =arrow_forward
- 6 5 4 3 2 1 -5 -4-3-2-1 1 5 6 -1 23 -2 -3 -4 -5 The graph above is a transformation of the function f(x) = |x| Write an equation for the function graphed above g(x) =arrow_forwardThe graph of y x² is shown on the grid. Graph y = = (x+3)² – 1. +10+ 69 8 7 5 4 9 432 6. 7 8 9 10 1 10 -9 -8 -7 -6 -5 -4 -3 -2 -1 1 2 3 4 5 -2 -3 -4 -5 -6- Clear All Draw:arrow_forwardSketch a graph of f(x) = 2(x − 2)² − 3 4 3 2 1 5 ས་ -5 -4 -3 -2 -1 1 2 3 4 -1 -2 -3 -4 -5+ Clear All Draw:arrow_forward
- 5. Find the arc length of the curve y = 3x³/2 from x = 0 to x = 4.arrow_forward-6 -5 * 10 8 6 4 2 -2 -1 -2 1 2 3 4 5 6 -6 -8 -10- The function graphed above is: Concave up on the interval(s) Concave down on the interval(s) There is an inflection point at:arrow_forward6 5 4 3 2 1 -6 -5 -3 -2 3 -1 -2 -3 -4 -5 The graph above is a transformation of the function x² Write an equation for the function graphed above g(x) =arrow_forward
 Calculus: Early TranscendentalsCalculusISBN:9781285741550Author:James StewartPublisher:Cengage Learning
 Thomas' Calculus (14th Edition)CalculusISBN:9780134438986Author:Joel R. Hass, Christopher E. Heil, Maurice D. WeirPublisher:PEARSON
 Calculus: Early Transcendentals (3rd Edition)CalculusISBN:9780134763644Author:William L. Briggs, Lyle Cochran, Bernard Gillett, Eric SchulzPublisher:PEARSON
 Calculus: Early TranscendentalsCalculusISBN:9781319050740Author:Jon Rogawski, Colin Adams, Robert FranzosaPublisher:W. H. Freeman
 Calculus: Early Transcendental FunctionsCalculusISBN:9781337552516Author:Ron Larson, Bruce H. EdwardsPublisher:Cengage Learning