
Concept explainers
Videos
a.
To make: a
a.
Answer to Problem 23E
Yes, a linear model is appropriate in the scatter plot.
Explanation of Solution
Given:
The given table shows the winning heights for the Olympic pole vault competitions up to the year 2020.
| Year | Height (m) | Year | Height (m) |
| 1 | 3 | ||
Calculation:
The scatter plot of the data is shown below:
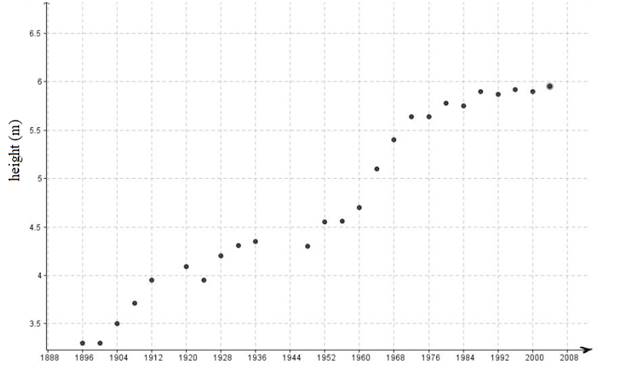
The points in the scatter plots follows a linear trend, so it is appropriate to use a linear model to describe this situation.
b.
To find: the graph and regression line.
b.
Answer to Problem 23E
Explanation of Solution
Given:
The given table shows the winning heights for the Olympic pole vault competitions up to the year 2020.
| Year | Height (m) | Year | Height (m) |
Calculation:
According to the table, to make a linear regression line and obtained the equation:
Now, graph of the regression line is shown below
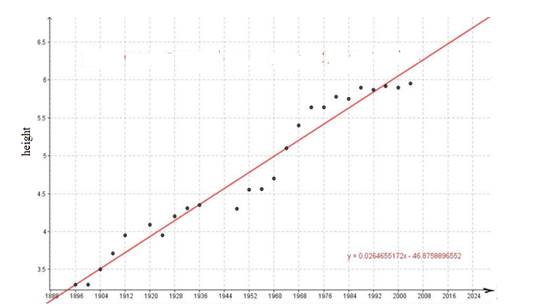
Hence, a linear regression line model is
c.
To predict: the height of the winning pole vault at 2004 Olympics and compare with actual winning height of 5.95 meters.
c.
Answer to Problem 23E
Explanation of Solution
From part (b)
Chirping rate is
Calculation:
The regression line of the equation is
The objective is to estimate the height for 2008 Olympics,
Plug
According to the linear model the winning height in 2008 Olympics should be close
It seems the model overvalued the winning height in 2008.
d.
To check: that it is reasonable to apply the model to predict the winning height at the 2010 Olympics.
d.
Answer to Problem 23E
It is not reasonable.
Explanation of Solution
Given:
The given model is
Calculation:
Plug the value of
It is hard to believe these athletes will be able to jump outstanding height of 8 meter.
Chapter 1 Solutions
Single Variable Calculus: Concepts and Contexts, Enhanced Edition


- Find a plane containing the point (3, -3, 1) and the line of intersection of the planes 2x + 3y - 3z = 14 and -3x - y + z = −21. The equation of the plane is:arrow_forwardDetermine whether the lines L₁ : F(t) = (−2, 3, −1)t + (0,2,-3) and L2 : ƒ(s) = (2, −3, 1)s + (−10, 17, -8) intersect. If they do, find the point of intersection. ● They intersect at the point They are skew lines They are parallel or equalarrow_forwardAnswer questions 2arrow_forward
- How does a fourier transform works?arrow_forwardDetermine the radius of convergence of a power series:12.6.5, 12.6.6, 12.6.7, 12.6.8Hint: Use Theorem12.5.1 and root test, ratio test, integral testarrow_forwardCan you answer this question and give step by step and why and how to get it. Can you write it (numerical method)arrow_forward
- Can you answer this question and give step by step and why and how to get it. Can you write it (numerical method)arrow_forwardThere are three options for investing $1150. The first earns 10% compounded annually, the second earns 10% compounded quarterly, and the third earns 10% compounded continuously. Find equations that model each investment growth and use a graphing utility to graph each model in the same viewing window over a 20-year period. Use the graph to determine which investment yields the highest return after 20 years. What are the differences in earnings among the three investment? STEP 1: The formula for compound interest is A = nt = P(1 + − − ) n², where n is the number of compoundings per year, t is the number of years, r is the interest rate, P is the principal, and A is the amount (balance) after t years. For continuous compounding, the formula reduces to A = Pert Find r and n for each model, and use these values to write A in terms of t for each case. Annual Model r=0.10 A = Y(t) = 1150 (1.10)* n = 1 Quarterly Model r = 0.10 n = 4 A = Q(t) = 1150(1.025) 4t Continuous Model r=0.10 A = C(t) =…arrow_forwardUse a graphing utility to find the point of intersection, if any, of the graphs of the functions. Round your result to three decimal places. (Enter NONE in any unused answer blanks.) y = 100e0.01x (x, y) = y = 11,250 ×arrow_forward
- 5. For the function y-x³-3x²-1, use derivatives to: (a) determine the intervals of increase and decrease. (b) determine the local (relative) maxima and minima. (e) determine the intervals of concavity. (d) determine the points of inflection. (e) sketch the graph with the above information indicated on the graph.arrow_forwardCan you solve this 2 question numerical methodarrow_forward1. Estimate the area under the graph of f(x)-25-x from x=0 to x=5 using 5 approximating rectangles Using: (A) right endpoints. (B) left endpoints.arrow_forward
 Calculus: Early TranscendentalsCalculusISBN:9781285741550Author:James StewartPublisher:Cengage Learning
 Thomas' Calculus (14th Edition)CalculusISBN:9780134438986Author:Joel R. Hass, Christopher E. Heil, Maurice D. WeirPublisher:PEARSON
 Calculus: Early Transcendentals (3rd Edition)CalculusISBN:9780134763644Author:William L. Briggs, Lyle Cochran, Bernard Gillett, Eric SchulzPublisher:PEARSON
 Calculus: Early TranscendentalsCalculusISBN:9781319050740Author:Jon Rogawski, Colin Adams, Robert FranzosaPublisher:W. H. Freeman
 Calculus: Early Transcendental FunctionsCalculusISBN:9781337552516Author:Ron Larson, Bruce H. EdwardsPublisher:Cengage Learning