
Concept explainers
Videos
a.
To make: a
a.
Answer to Problem 21E
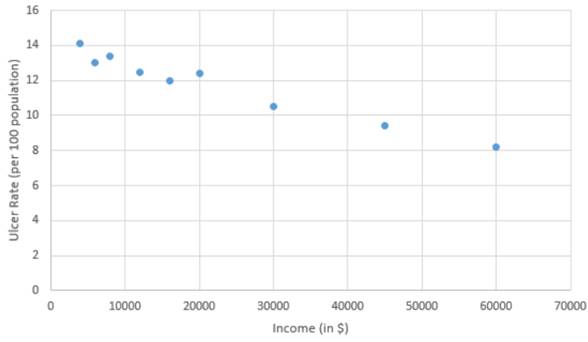
The scatter plot of the data is shown below.
Explanation of Solution
Given:
The given table shows peptic rules ulcer rates for various rates:
| Income | Ulcer rate(per 100 population) |
Calculation:
The scatter plot of the data is shown below:
b.
To find: a linear model using the first and last data points and graph the linear model.
b.
Answer to Problem 21E
Explanation of Solution
Given:
The given table shows peptic rules ulcer rates for various rates:
| Income | Ulcer rate(per 100 population) |
Calculation:
According to the table, the first point is
The slope of the linear equation is given by
So,
Now, use the given point slope form to write the equation of the line. It is to choose any of the two points to use. Point-slope form of the equation is given by
Now, if it choose the first point, it get
In order to solve for y , it must first distribute
The graph of the linear model is shown below:
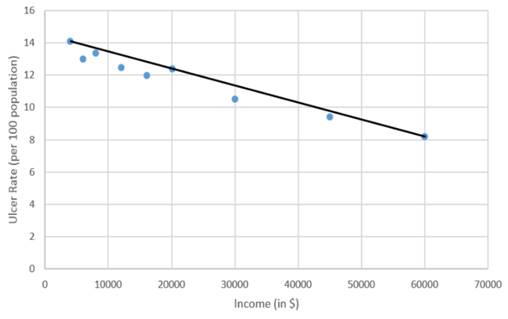
Hence, a linear model using the first and last data points is
c.
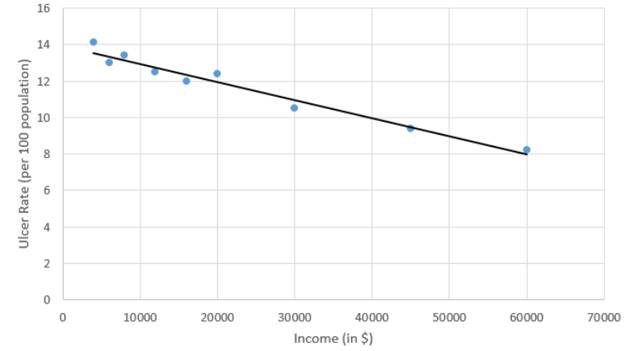
To find: the least squares regression line and graph the regression line.
c.
Answer to Problem 21E
Explanation of Solution
Given:
The given table shows peptic rules ulcer rates for various rates:
| Income | Ulcer rate(per 100 population) |
Calculation:
To find the linear regression, use the
Step 1: Hit STAT and then press enter when Edit is highlighted.
Step 2: Enter the x-coordinate under the
Step 3: Hit STAT, use the arrow key to scroll right to CALC and the scroll down to
Step 4: Press Enter multiples time until the program runs. If X list does not show
Step 5: The program will output values for a and b .
The program outputs the values of
Hence, the least squares regression line
So, the least squares regression line is shown below:
d.
To estimate: the ulcer rate for an income of
d.
Answer to Problem 21E
Explanation of Solution
Given:
From part (c)
Calculation:
It is known from part (c), the equation of the linear model according to Least Squares Regression Line approach:
When the income rate is
Hence, the ulcer rate for an income of
e.
To check: how likely is someone with an income of
e.
Answer to Problem 21E
Explanation of Solution
Given:
The given model is
Calculation:
In this case
There is a chance of approximately
f.
To check: that it is reasonable to apply the model to someone with an income of
f.
Answer to Problem 21E
It is not reasonable.
Explanation of Solution
Given:
The given model is
Calculation:
It will be not reasonable to apply the linear model to someone with an income of
Besides, apply the equation, it is finding a negative ulcer rate which is an irrational number
Chapter 1 Solutions
Single Variable Calculus: Concepts and Contexts, Enhanced Edition


- An airplane flies due west at an airspeed of 428 mph. The wind blows in the direction of 41° south of west at 50 mph. What is the ground speed of the airplane? What is the bearing of the airplane? 428 mph 41° 50 mph a. The ground speed of the airplane is b. The bearing of the airplane is mph. south of west.arrow_forwardRylee's car is stuck in the mud. Roman and Shanice come along in a truck to help pull her out. They attach one end of a tow strap to the front of the car and the other end to the truck's trailer hitch, and the truck starts to pull. Meanwhile, Roman and Shanice get behind the car and push. The truck generates a horizontal force of 377 lb on the car. Roman and Shanice are pushing at a slight upward angle and generate a force of 119 lb on the car. These forces can be represented by vectors, as shown in the figure below. The angle between these vectors is 20.2°. Find the resultant force (the vector sum), then give its magnitude and its direction angle from the positive x-axis. 119 lb 20.2° 377 lb a. The resultant force is (Tip: omit degree notations from your answers; e.g. enter cos(45) instead of cos(45°)) b. It's magnitude is lb. c. It's angle from the positive x-axis isarrow_forwardFind a plane containing the point (3, -3, 1) and the line of intersection of the planes 2x + 3y - 3z = 14 and -3x - y + z = −21. The equation of the plane is:arrow_forward
- Determine whether the lines L₁ : F(t) = (−2, 3, −1)t + (0,2,-3) and L2 : ƒ(s) = (2, −3, 1)s + (−10, 17, -8) intersect. If they do, find the point of intersection. ● They intersect at the point They are skew lines They are parallel or equalarrow_forwardAnswer questions 2arrow_forwardHow does a fourier transform works?arrow_forward
- Determine the radius of convergence of a power series:12.6.5, 12.6.6, 12.6.7, 12.6.8Hint: Use Theorem12.5.1 and root test, ratio test, integral testarrow_forwardCan you answer this question and give step by step and why and how to get it. Can you write it (numerical method)arrow_forwardCan you answer this question and give step by step and why and how to get it. Can you write it (numerical method)arrow_forward
- There are three options for investing $1150. The first earns 10% compounded annually, the second earns 10% compounded quarterly, and the third earns 10% compounded continuously. Find equations that model each investment growth and use a graphing utility to graph each model in the same viewing window over a 20-year period. Use the graph to determine which investment yields the highest return after 20 years. What are the differences in earnings among the three investment? STEP 1: The formula for compound interest is A = nt = P(1 + − − ) n², where n is the number of compoundings per year, t is the number of years, r is the interest rate, P is the principal, and A is the amount (balance) after t years. For continuous compounding, the formula reduces to A = Pert Find r and n for each model, and use these values to write A in terms of t for each case. Annual Model r=0.10 A = Y(t) = 1150 (1.10)* n = 1 Quarterly Model r = 0.10 n = 4 A = Q(t) = 1150(1.025) 4t Continuous Model r=0.10 A = C(t) =…arrow_forwardUse a graphing utility to find the point of intersection, if any, of the graphs of the functions. Round your result to three decimal places. (Enter NONE in any unused answer blanks.) y = 100e0.01x (x, y) = y = 11,250 ×arrow_forward5. For the function y-x³-3x²-1, use derivatives to: (a) determine the intervals of increase and decrease. (b) determine the local (relative) maxima and minima. (e) determine the intervals of concavity. (d) determine the points of inflection. (e) sketch the graph with the above information indicated on the graph.arrow_forward
 Calculus: Early TranscendentalsCalculusISBN:9781285741550Author:James StewartPublisher:Cengage Learning
 Thomas' Calculus (14th Edition)CalculusISBN:9780134438986Author:Joel R. Hass, Christopher E. Heil, Maurice D. WeirPublisher:PEARSON
 Calculus: Early Transcendentals (3rd Edition)CalculusISBN:9780134763644Author:William L. Briggs, Lyle Cochran, Bernard Gillett, Eric SchulzPublisher:PEARSON
 Calculus: Early TranscendentalsCalculusISBN:9781319050740Author:Jon Rogawski, Colin Adams, Robert FranzosaPublisher:W. H. Freeman
 Calculus: Early Transcendental FunctionsCalculusISBN:9781337552516Author:Ron Larson, Bruce H. EdwardsPublisher:Cengage Learning