Videos
In an experiment published in the journal Cell in 2014, Amnon Koren and Steven McCarroll isolated two populations of growing tissue culture cells from each of two unrelated people from different parts of the world.
One population from each person consisted of millions of cells that were in G of the cell cycle; the other population was a similar number of cells that were in S phase for various amounts of time. The scientists then performed high-throughput DNA sequencing on these cell populations.
The two graphs that follow show the data for the two individuals. In each graph, the x-axis represents positions along a chromosome (here, chromosome 8), and the y-axis represents the ratio between the number of reads obtained for a given region of the genome from the S phase sample divided by the number of reads obtained for the same region from the G sample. Each small purple dot is 2 kb along the chromosome; the black line is the moving average of the purple.
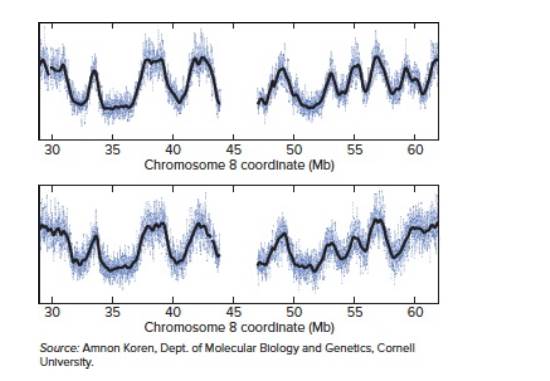
| a. | At chromosomal coordinate 33 Mb, the y-axis value is much higher than at coordinate 35 Mb. What does this fact tell you about the timing of |
| b. | Scientists still do not have a good idea about the nature of DNA sequences or chromatin structures that define origins of replication in human cells. If you were trying to locate such origins of replication, where would you look? |
| c. | Suppose you did a similar experiment using two populations with the same number of cells, one population in G and the other in G . If you graphed the data in a similar fashion, with the y-axis representing the ratio of the number of reads from the G sample divided by the number of reads from the G sample, what would the plot look like? |
| d. | The patterns for these two people are very nearly the same, even though they are completely unrelated. What does this fact suggest? |
| e. | These scientists later reasoned that they could obtain the same kind of information from any person whose genome had been sequenced by high-throughput methods, without separating out populations of cells at different cell cycle stages. What would have to be true about the cells analyzed and the kinds of data available? Why would you want to look at this data from many different people? |
Want to see the full answer?
Check out a sample textbook solution
Chapter 12 Solutions
Genetics: From Genes to Genomes


- "One of the symmetry breaking events in mouse gastrulation requires the amplification of Nodal on the side of the embryo opposite to the Anterior Visceral Endoderm (AVE). Describe one way by which Nodal gets amplified in this region." My understanding of this is that there are a few ways nodal is amplified though I'm not sure if this is specifically occurs on the opposite side of the AVE. 1. pronodal cleaved by protease -> active nodal 2. Nodal -> BMP4 -> Wnt-> nodal 3. Nodal-> Nodal, Fox1 binding site 4. BMP4 on outside-> nodal Are all of these occuring opposite to AVE?arrow_forwardIf four babies are born on a given day What is the chance all four will be girls? Use genetics lawsarrow_forwardExplain each punnet square results (genotypes and probabilities)arrow_forward
- Give the terminal regression line equation and R or R2 value: Give the x axis (name and units, if any) of the terminal line: Give the y axis (name and units, if any) of the terminal line: Give the first residual regression line equation and R or R2 value: Give the x axis (name and units, if any) of the first residual line : Give the y axis (name and units, if any) of the first residual line: Give the second residual regression line equation and R or R2 value: Give the x axis (name and units, if any) of the second residual line: Give the y axis (name and units, if any) of the second residual line: a) B1 Solution b) B2 c)hybrid rate constant (λ1) d)hybrid rate constant (λ2) e) ka f) t1/2,absorb g) t1/2, dist h) t1/2, elim i)apparent central compartment volume (V1,app) j) total AUC (short cut method) k) apparent volume of distribution based on AUC (VAUC,app) l)apparent clearance (CLapp) m) absolute bioavailability of oral route (need AUCiv…arrow_forwardYou inject morpholino oligonucleotides that inhibit the translation of follistatin, chordin, and noggin (FCN) at the 1 cell stage of a frog embryo. What is the effect on neurulation in the resulting embryo? Propose an experiment that would rescue an embryo injected with FCN morpholinos.arrow_forwardParticipants will be asked to create a meme regarding a topic relevant to the department of Geography, Geomatics, and Environmental Studies. Prompt: Using an online art style of your choice, please make a meme related to the study of Geography, Environment, or Geomatics.arrow_forward
- Plekhg5 functions in bottle cell formation, and Shroom3 functions in neural plate closure, yet the phenotype of injecting mRNA of each into the animal pole of a fertilized egg is very similar. What is the phenotype, and why is the phenotype so similar? Is the phenotype going to be that there is a disruption of the formation of the neural tube for both of these because bottle cell formation is necessary for the neural plate to fold in forming the neural tube and Shroom3 is further needed to close the neural plate? So since both Plekhg5 and Shroom3 are used in forming the neural tube, injecting the mRNA will just lead to neural tube deformity?arrow_forwardWhat are some medical issues or health trends that may have a direct link to the idea of keeping fat out of diets?arrow_forwardwhat did charles darwin do in sciencearrow_forward
 Biology: The Dynamic Science (MindTap Course List)BiologyISBN:9781305389892Author:Peter J. Russell, Paul E. Hertz, Beverly McMillanPublisher:Cengage Learning
 Human Heredity: Principles and Issues (MindTap Co...BiologyISBN:9781305251052Author:Michael CummingsPublisher:Cengage Learning
 Biology 2eBiologyISBN:9781947172517Author:Matthew Douglas, Jung Choi, Mary Ann ClarkPublisher:OpenStax
 Biology Today and Tomorrow without Physiology (Mi...BiologyISBN:9781305117396Author:Cecie Starr, Christine Evers, Lisa StarrPublisher:Cengage Learning
 Concepts of BiologyBiologyISBN:9781938168116Author:Samantha Fowler, Rebecca Roush, James WisePublisher:OpenStax College
 Human Biology (MindTap Course List)BiologyISBN:9781305112100Author:Cecie Starr, Beverly McMillanPublisher:Cengage Learning