Interpretation:
The reagent used to accomplish the given transformation has to be identified.
Concept Introduction:
Radical Bromination is a process in which the bromine atom is obtained as radical due to irradiation and this attack the carbon atom to form the brominated product. The bromine atom gets substituted in the more substituted carbon atom.
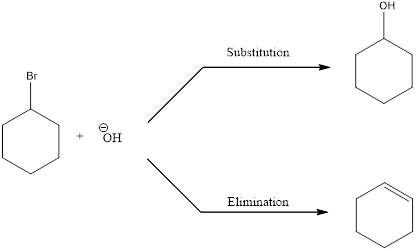
Elimination reactions are the one in which the groups are lost and the saturated bonds are converted to unsaturated bonds. Usually the substitution reaction compete with elimination reaction.

In elimination reaction, the beta proton is removed together with the leaving group to form a double bond.
E2 reaction proceeds through a single step without any formation of intermediates. The base abstracts a proton form the substrate and the loss of leaving group also happens resulting in the formation of double bond. E2 stands for bimolecular elimination.
The proton can be abstracted by the base in two different ways leading to a regiochemical outcome. In the given reaction below, two

The two alkenes that are formed can be given different names. If the alkene is more substituted means it is known as Zaitsev product, and if the alkene formed is less substituted means it is known as Hofmann product. Generally more substituted product is the major product (Zaitsev product).
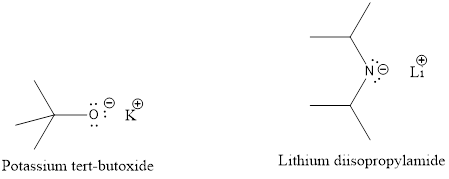
If the reaction is performed with a sterically hindered base, the major product will be less substituted alkene (Hofmann product). The regiochemical outcome can be decided by choosing the base. Some of the sterically hindered bases are,

Want to see the full answer?
Check out a sample textbook solution
Chapter 11 Solutions
ORGANIC CHEMISTRY-NEXTGEN+BOX (1 SEM.)
- Using wedge-and-dash bonds, modify the bonds on the chiral carbon in the molecule below so the molecule has R stereochemical configuration. NH H Br X टेarrow_forwardProvide photos of models of the following molecules. (Include a key for identification of the atoms) 1,2-dichloropropane 2,3,3-trimethylhexane 2-bromo-3-methybutanearrow_forwardPlease draw the structure in the box that is consistent with all the spectral data and alphabetically label all of the equivalent protons in the structure (Ha, Hb, Hc....) in order to assign all the proton NMR peaks. The integrations are computer generated and approximate the number of equivalent protons. Molecular formula: C13H1802 14 13 12 11 10 11 (ppm) Structure with assigned H peaks 2.08 3.13arrow_forward
- A 0.10 M solution of acetic acid (CH3COOH, Ka = 1.8 x 10^-5) is titrated with a 0.0250 M solution of magnesium hydroxide (Mg(OH)2). If 10.0 mL of the acid solution is titrated with 10.0 mL of the base solution, what is the pH of the resulting solution?arrow_forwardFirefly luciferin exhibits three rings. Identify which of the rings are aromatic. Identify which lone pairs are involved in establishing aromaticity. The lone pairs are labeled A-D below.arrow_forwardA 0.10 M solution of acetic acid (CH3COOH, Ka = 1.8 x 10^-5) is titrated with a 0.0250 M solution of magnesium hydroxide (Mg(OH)2). If 10.0 mL of the acid solution is titrated with 10.0 mL of the base solution, what is the pH of the resulting solution?arrow_forward
- Given a complex reaction with rate equation v = k1[A] + k2[A]2, what is the overall reaction order?arrow_forwardPlease draw the structure in the box that is consistent with all the spectral data and alphabetically label all of the equivalent protons in the structure (Ha, Hb, Hc....) in order to assign all the proton NMR peaks. The integrations are computer generated and approximate the number of equivalent protons. Molecular formula: C13H1802 14 13 12 11 10 11 (ppm) Structure with assigned H peaks 2.08 3.13arrow_forwardCHEMICAL KINETICS. One of the approximation methods for solving the rate equation is the steady-state approximation method. Explain what it consists of.arrow_forward
- CHEMICAL KINETICS. One of the approximation methods for solving the rate equation is the limiting or determining step approximation method. Explain what it consists of.arrow_forwardCHEMICAL KINETICS. Indicate the approximation methods for solving the rate equation.arrow_forwardTRANSMITTANCE เบบ Please identify the one structure below that is consistent with the 'H NMR and IR spectra shown and draw its complete structure in the box below with the protons alphabetically labeled as shown in the NMR spectrum and label the IR bands, including sp³C-H and sp2C-H stretch, indicated by the arrows. D 4000 OH LOH H₂C CH3 OH H₂C OCH3 CH3 OH 3000 2000 1500 HAVENUMBERI-11 1000 LOCH3 Draw your structure below and label its equivalent protons according to the peak labeling that is used in the NMR spectrum in order to assign the peaks. Integrals indicate number of equivalent protons. Splitting patterns are: s=singlet, d=doublet, m-multiplet 8 3Hb s m 1Hd s 3Hf m 2Hcd 2Had 1He 鄙视 m 7 7 6 5 4 3 22 500 T 1 0arrow_forward
 ChemistryChemistryISBN:9781305957404Author:Steven S. Zumdahl, Susan A. Zumdahl, Donald J. DeCostePublisher:Cengage Learning
 ChemistryChemistryISBN:9781259911156Author:Raymond Chang Dr., Jason Overby ProfessorPublisher:McGraw-Hill Education
 Principles of Instrumental AnalysisChemistryISBN:9781305577213Author:Douglas A. Skoog, F. James Holler, Stanley R. CrouchPublisher:Cengage Learning
 Organic ChemistryChemistryISBN:9780078021558Author:Janice Gorzynski Smith Dr.Publisher:McGraw-Hill Education
 Chemistry: Principles and ReactionsChemistryISBN:9781305079373Author:William L. Masterton, Cecile N. HurleyPublisher:Cengage Learning
 Elementary Principles of Chemical Processes, Bind...ChemistryISBN:9781118431221Author:Richard M. Felder, Ronald W. Rousseau, Lisa G. BullardPublisher:WILEY


