
Statistics: The Art and Science of Learning from Data (4th Edition)
4th Edition
ISBN: 9780321997838
Author: Alan Agresti, Christine A. Franklin, Bernhard Klingenberg
Publisher: PEARSON
expand_more
expand_more
format_list_bulleted
Concept explainers
Videos
Textbook Question
Chapter 11.3, Problem 24PB
Democrat, race, and gender The two tables show 2012 GSS data on whether someone is identified as Democrat, by race and by gender.
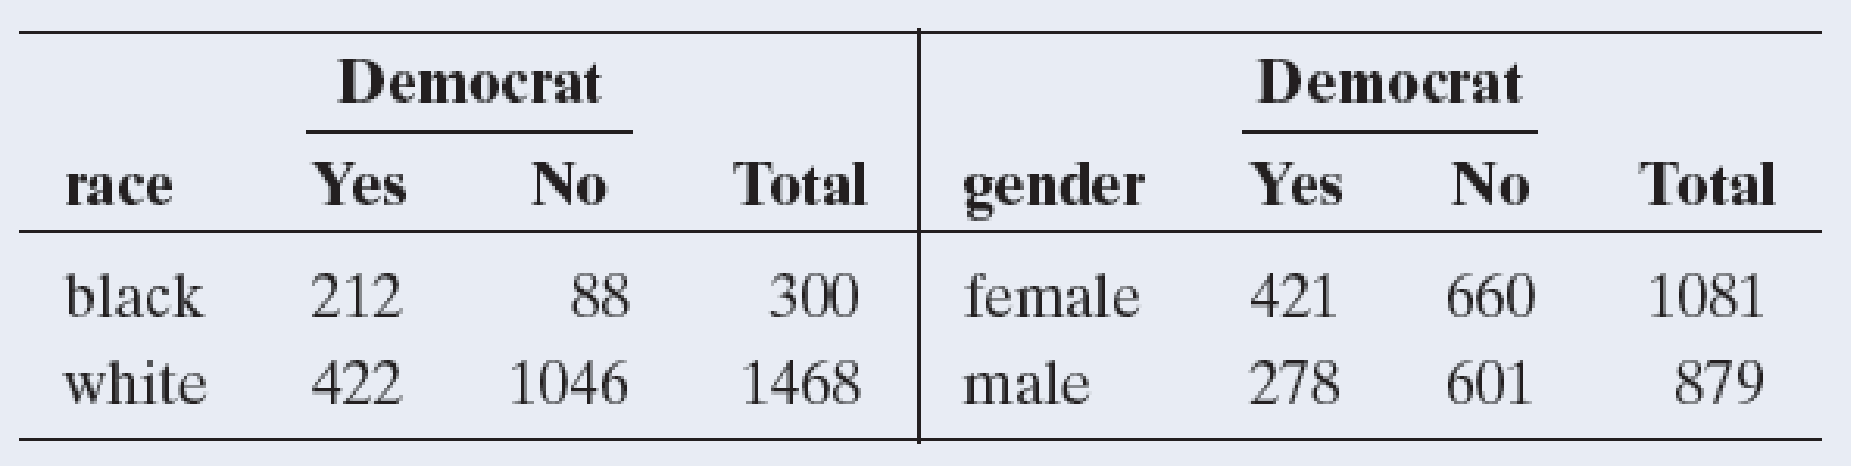
- a. Find the difference of proportions between blacks and whites and between females and males. Interpret each. Which variable has a stronger association with whether someone identifies as Democrat, race or gender? Explain.
- b. Find the ratio of proportions between blacks and whites and between females and males. Interpret each. Which variable has a stronger association with whether someone identifies as Democrat, race or gender? Explain.
- c. Find the odds of identifying as Democrat for blacks and whites and interpret each. Then find the odds ratio and interpret.
Expert Solution & Answer
Want to see the full answer?
Check out a sample textbook solution
Students have asked these similar questions
COM WIth Chegg Cheg x +
w:/r/sites/TertiaryStudents/_layouts/15/Doc.aspx?sourcedoc=%7B2759DFAB-EA5E-4526-9991-9087A973B894%.
QUAT6221wA1
Accessibility Mode
Immersi
The following table indicates the unit prices (in Rands) and quantities of three meals sold every year
by a small restaurant over the years 2023 and 2025.
2023
2025
MEAL
Unit Price (po) Quantity (q0))
Unit Price (P₁)
Quantity (q₁)
Lasagne
R125
1055
R145
1125
Pizza
R110
2115
R130
2195
Pasta
R95
1950
R120
2250
Q.2.1
Using 2023 as the base year, compute the individual price relatives in 2025 for (10)
lasagne and pasta. Interpret each of your answers.
0.2.2
Using 2023 as the base year, compute the Laspeyres price index for all of the meals (8)
for 2025. Interpret your answer.
Q.2.3
Using 2023 as the base year, compute the Paasche price index for all of the meals (7)
for 2025. Interpret your answer.
Q Search
L
O
W
L
QUAI6221wA1.docx
X
+
int.com/:w:/r/sites/TertiaryStudents/_layouts/15/Doc.aspx?sourcedoc=%7B2759DFAB-EA5E-4526-9991-9087A973B894%7
26
QUAT6221wA1
Q.1.1.8
One advantage of primary data is that:
(1) It is low quality
(2) It is irrelevant to the purpose at hand
(3) It is time-consuming to collect
(4) None of the other options
Accessibility Mode
Immersive R
Q.1.1.9
A sample of fifteen apples is selected from an orchard. We would
refer to one of these apples as:
(2)
ھا
(1) A parameter
(2) A descriptive statistic
(3) A statistical model
A sampling unit
Q.1.1.10
Categorical data, where the categories do not have implied
ranking, is referred to as:
(2)
Search
D
(2)
1+
PrtSc
Insert
Delete
F8
F10
F11
F12
Backspace
10
ENG
US
epoint.com/:w:/r/sites/TertiaryStudents/_layouts/15/Doc.aspx?sourcedoc=%7B2759DFAB-EA5E-4526-9991-9087A
23;24; 25
R
QUAT6221WA1
Accessibility Mode
DE
2025
Q.1.1.4
Data obtained from outside an organisation is referred to as:
(2)
45
(1) Outside data
(2) External data
(3) Primary data
(4) Secondary data
Q.1.1.5
Amongst other disadvantages, which type of data may not be
problem-specific and/or may be out of date?
W
(2)
E
(1) Ordinal scaled data
(2) Ratio scaled data
(3) Quantitative, continuous data
(4) None of the other options
Search
F8
F10
PrtSc
Insert
F11
F12
0
+ /1
Backspa
Chapter 11 Solutions
Statistics: The Art and Science of Learning from Data (4th Edition)
Ch. 11.1 - Gender gap in politics? In the United States, is...Ch. 11.1 - Prob. 2PBCh. 11.1 - Williams College admission Data from 2013 posted...Ch. 11.1 - Prob. 4PBCh. 11.1 - Marital happiness and income In the GSS, subjects...Ch. 11.1 - What is independent of happiness? Which one of the...Ch. 11.1 - Sample evidence about independence Refer to the...Ch. 11.2 - Life after death and gender In the 2012 GSS, 605...Ch. 11.2 - Happiness and gender For the 2 3 table on gender...Ch. 11.2 - Prob. 10PB
Ch. 11.2 - Marital happiness and income In Exercise 11.5 when...Ch. 11.2 - First and second free throw independent? In pro...Ch. 11.2 - Cigarettes and marijuana The table on the...Ch. 11.2 - Prob. 14PBCh. 11.2 - Help the environment In 2010 the GSS asked whether...Ch. 11.2 - Prob. 16PBCh. 11.2 - Aspirin and heart attacks A Swedish study used...Ch. 11.2 - z test for heart attack study Refer to the...Ch. 11.2 - Severity of fever after flu shot The study...Ch. 11.2 - Prob. 20PBCh. 11.2 - Testing a genetic theory In an experiment on...Ch. 11.2 - Birthdays by quarters Based on a random sample of...Ch. 11.2 - Checking a roulette wheel Karl Pearson devised the...Ch. 11.3 - Democrat, race, and gender The two tables show...Ch. 11.3 - Death penalty associations Table 11.10, summarized...Ch. 11.3 - Smoking and alcohol The table refers to a survey...Ch. 11.3 - Sex of victim and offender For murders in the...Ch. 11.3 - Smelling and mortality A recent study (Pinto et...Ch. 11.3 - Vioxx In September 2004, the pharmaceutical...Ch. 11.3 - Egg and cell derived vaccine When comparing the...Ch. 11.3 - Risk of dying for teenagers According to...Ch. 11.3 - Marital happiness The table shows 2012 GSS data on...Ch. 11.3 - Party ID and gender The table shows the 2012 GSS...Ch. 11.3 - Chi-squared versus measuring association For the...Ch. 11.4 - Standardized residuals for happiness and income...Ch. 11.4 - Prob. 36PBCh. 11.4 - Prob. 37PBCh. 11.4 - Prob. 38PBCh. 11.4 - Prob. 39PBCh. 11.4 - Prob. 40PBCh. 11.5 - Keeping old dogs mentally sharp In an experiment...Ch. 11.5 - Prob. 43PBCh. 11.5 - Prob. 44PBCh. 11.5 - Prob. 46PBCh. 11 - Female for president? When recent General Social...Ch. 11 - Prob. 48CPCh. 11 - Down and chi-squared For the data in the previous...Ch. 11 - Prob. 50CPCh. 11 - Prob. 51CPCh. 11 - Prob. 52CPCh. 11 - Prob. 53CPCh. 11 - Prob. 54CPCh. 11 - Prob. 55CPCh. 11 - Prob. 56CPCh. 11 - Seat belt helps? The table refers to passengers in...Ch. 11 - Prob. 58CPCh. 11 - Prob. 59CPCh. 11 - Prob. 60CPCh. 11 - Prob. 61CPCh. 11 - Prob. 62CPCh. 11 - Prob. 63CPCh. 11 - Prob. 64CPCh. 11 - Clarity of diamonds Does the clarity of a diamond...Ch. 11 - Benfords Law When looking at a collection of...Ch. 11 - Prob. 67CPCh. 11 - Prob. 68CPCh. 11 - Prob. 70CPCh. 11 - Prob. 71CPCh. 11 - Prob. 72CPCh. 11 - Prob. 73CPCh. 11 - Prob. 74CPCh. 11 - Prob. 75CPCh. 11 - Prob. 76CPCh. 11 - Prob. 77CPCh. 11 - Prob. 78CPCh. 11 - Prob. 79CPCh. 11 - Statistical versus practical significance In any...Ch. 11 - Prob. 81CPCh. 11 - Multiple response variables Each subject in a...Ch. 11 - Standardized residuals for 2 2 tables The table...Ch. 11 - Prob. 84CPCh. 11 - Prob. 85CPCh. 11 - Prob. 86CPCh. 11 - Prob. 87CPCh. 11 - Prob. 88CPCh. 11 - Voting with 16 A recent survey of Austrian high...
Knowledge Booster


Learn more about
Need a deep-dive on the concept behind this application? Look no further. Learn more about this topic, statistics and related others by exploring similar questions and additional content below.Similar questions
- /r/sites/TertiaryStudents/_layouts/15/Doc.aspx?sourcedoc=%7B2759DFAB-EA5E-4526-9991-9087A973B894%7D&file=Qu Q.1.1.14 QUAT6221wA1 Accessibility Mode Immersive Reader You are the CFO of a company listed on the Johannesburg Stock Exchange. The annual financial statements published by your company would be viewed by yourself as: (1) External data (2) Internal data (3) Nominal data (4) Secondary data Q.1.1.15 Data relevancy refers to the fact that data selected for analysis must be: (2) Q Search (1) Checked for errors and outliers (2) Obtained online (3) Problem specific (4) Obtained using algorithms U E (2) 100% 高 W ENG A US F10 点 F11 社 F12 PrtSc 11 + Insert Delete Backspacearrow_forwardA client of a commercial rose grower has been keeping records on the shelf-life of a rose. The client sent the following frequency distribution to the grower. Rose Shelf-Life Days of Shelf-Life Frequency fi 1-5 2 6-10 4 11-15 7 16-20 6 21-25 26-30 5 2 Step 2 of 2: Calculate the population standard deviation for the shelf-life. Round your answer to two decimal places, if necessary.arrow_forwardA market research firm used a sample of individuals to rate the purchase potential of a particular product before and after the individuals saw a new television commercial about the product. The purchase potential ratings were based on a 0 to 10 scale, with higher values indicating a higher purchase potential. The null hypothesis stated that the mean rating "after" would be less than or equal to the mean rating "before." Rejection of this hypothesis would show that the commercial improved the mean purchase potential rating. Use = .05 and the following data to test the hypothesis and comment on the value of the commercial. Purchase Rating Purchase Rating Individual After Before Individual After Before 1 6 5 5 3 5 2 6 4 6 9 8 3 7 7 7 7 5 4 4 3 8 6 6 What are the hypotheses?H0: d Ha: d Compute (to 3 decimals).Compute sd (to 1 decimal). What is the p-value?The p-value is What is your decision?arrow_forward
- Please help me with the following statistics questionFor question (e), the options are:Assuming that the null hypothesis is (false/true), the probability of (other populations of 150/other samples of 150/equal to/more data/greater than) will result in (stronger evidence against the null hypothesis than the current data/stronger evidence in support of the null hypothesis than the current data/rejecting the null hypothesis/failing to reject the null hypothesis) is __.arrow_forwardPlease help me with the following question on statisticsFor question (e), the drop down options are: (From this data/The census/From this population of data), one can infer that the mean/average octane rating is (less than/equal to/greater than) __. (use one decimal in your answer).arrow_forwardHelp me on the following question on statisticsarrow_forward
- 3. [15] The joint PDF of RVS X and Y is given by fx.x(x,y) = { x) = { c(x + { c(x+y³), 0, 0≤x≤ 1,0≤ y ≤1 otherwise where c is a constant. (a) Find the value of c. (b) Find P(0 ≤ X ≤,arrow_forwardNeed help pleasearrow_forward7. [10] Suppose that Xi, i = 1,..., 5, are independent normal random variables, where X1, X2 and X3 have the same distribution N(1, 2) and X4 and X5 have the same distribution N(-1, 1). Let (a) Find V(X5 - X3). 1 = √(x1 + x2) — — (Xx3 + x4 + X5). (b) Find the distribution of Y. (c) Find Cov(X2 - X1, Y). -arrow_forwardarrow_back_iosSEE MORE QUESTIONSarrow_forward_ios
Recommended textbooks for you
 Glencoe Algebra 1, Student Edition, 9780079039897...AlgebraISBN:9780079039897Author:CarterPublisher:McGraw Hill
 Big Ideas Math A Bridge To Success Algebra 1: Stu...AlgebraISBN:9781680331141Author:HOUGHTON MIFFLIN HARCOURTPublisher:Houghton Mifflin Harcourt
 Holt Mcdougal Larson Pre-algebra: Student Edition...AlgebraISBN:9780547587776Author:HOLT MCDOUGALPublisher:HOLT MCDOUGAL
Glencoe Algebra 1, Student Edition, 9780079039897...
Algebra
ISBN:9780079039897
Author:Carter
Publisher:McGraw Hill
Big Ideas Math A Bridge To Success Algebra 1: Stu...
Algebra
ISBN:9781680331141
Author:HOUGHTON MIFFLIN HARCOURT
Publisher:Houghton Mifflin Harcourt
Holt Mcdougal Larson Pre-algebra: Student Edition...
Algebra
ISBN:9780547587776
Author:HOLT MCDOUGAL
Publisher:HOLT MCDOUGAL
Probability & Statistics (28 of 62) Basic Definitions and Symbols Summarized; Author: Michel van Biezen;https://www.youtube.com/watch?v=21V9WBJLAL8;License: Standard YouTube License, CC-BY
Introduction to Probability, Basic Overview - Sample Space, & Tree Diagrams; Author: The Organic Chemistry Tutor;https://www.youtube.com/watch?v=SkidyDQuupA;License: Standard YouTube License, CC-BY