
Statistics: The Art and Science of Learning from Data (4th Edition)
4th Edition
ISBN: 9780321997838
Author: Alan Agresti, Christine A. Franklin, Bernhard Klingenberg
Publisher: PEARSON
expand_more
expand_more
format_list_bulleted
Videos
Textbook Question
Chapter 11.1, Problem 1PB
Gender gap in politics? In the United States, is there a gender gap in political beliefs? That is, do women and men tend to differ in their political thinking and voting behavior? The table taken from the 2012 GSS relates gender and political party identification. Subjects indicated whether they identified more strongly with the Democratic or Republican party or as Independents.
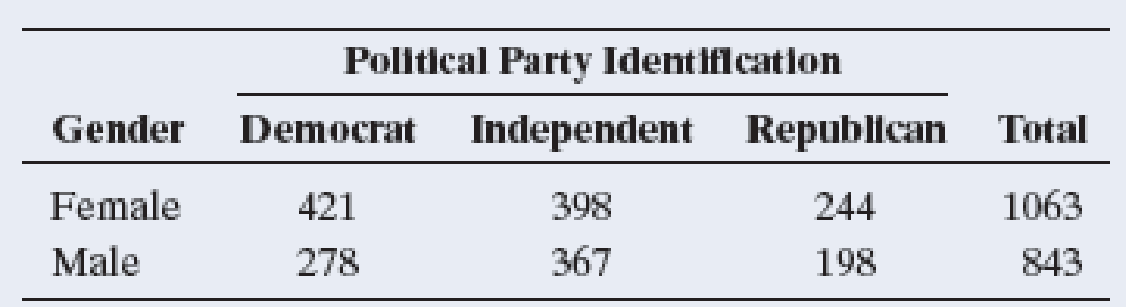
Source: Data from CSM, UC Berkeley.
- a. Identify the response variable and the explanatory variable.
- b. Construct a table that shows the conditional distributions of the response variable. Interpret.
- c. Give a hypothetical example of population conditional distributions for which these variables would be independent.
- d. Sketch bar graphs to portray the distributions in part b and in part c.
Expert Solution & Answer
Want to see the full answer?
Check out a sample textbook solution
Students have asked these similar questions
Consider an event X comprised of three outcomes whose probabilities are 9/18, 1/18,and 6/18.
Compute the probability of the complement of the event.
Question content area bottom
Part 1
A.1/2
B.2/18
C.16/18
D.16/3
John and Mike were offered mints. What is the probability that at least John or Mike would respond favorably? (Hint: Use the classical definition.)
Question content area bottom
Part 1
A.1/2
B.3/4
C.1/8
D.3/8
The details of the clock sales at a supermarket for the past 6 weeks are shown in the table below. The time series appears to be relatively stable, without trend, seasonal, or cyclical effects. The simple moving average value of k is set at 2. What is the simple moving average root mean square error? Round to two decimal places.
Week
Units sold
1
88
2
44
3
54
4
65
5
72
6
85
Question content area bottom
Part 1
A.
207.13
B.
20.12
C.
14.39
D.
0.21
Chapter 11 Solutions
Statistics: The Art and Science of Learning from Data (4th Edition)
Ch. 11.1 - Gender gap in politics? In the United States, is...Ch. 11.1 - Prob. 2PBCh. 11.1 - Williams College admission Data from 2013 posted...Ch. 11.1 - Prob. 4PBCh. 11.1 - Marital happiness and income In the GSS, subjects...Ch. 11.1 - What is independent of happiness? Which one of the...Ch. 11.1 - Sample evidence about independence Refer to the...Ch. 11.2 - Life after death and gender In the 2012 GSS, 605...Ch. 11.2 - Happiness and gender For the 2 3 table on gender...Ch. 11.2 - Prob. 10PB
Ch. 11.2 - Marital happiness and income In Exercise 11.5 when...Ch. 11.2 - First and second free throw independent? In pro...Ch. 11.2 - Cigarettes and marijuana The table on the...Ch. 11.2 - Prob. 14PBCh. 11.2 - Help the environment In 2010 the GSS asked whether...Ch. 11.2 - Prob. 16PBCh. 11.2 - Aspirin and heart attacks A Swedish study used...Ch. 11.2 - z test for heart attack study Refer to the...Ch. 11.2 - Severity of fever after flu shot The study...Ch. 11.2 - Prob. 20PBCh. 11.2 - Testing a genetic theory In an experiment on...Ch. 11.2 - Birthdays by quarters Based on a random sample of...Ch. 11.2 - Checking a roulette wheel Karl Pearson devised the...Ch. 11.3 - Democrat, race, and gender The two tables show...Ch. 11.3 - Death penalty associations Table 11.10, summarized...Ch. 11.3 - Smoking and alcohol The table refers to a survey...Ch. 11.3 - Sex of victim and offender For murders in the...Ch. 11.3 - Smelling and mortality A recent study (Pinto et...Ch. 11.3 - Vioxx In September 2004, the pharmaceutical...Ch. 11.3 - Egg and cell derived vaccine When comparing the...Ch. 11.3 - Risk of dying for teenagers According to...Ch. 11.3 - Marital happiness The table shows 2012 GSS data on...Ch. 11.3 - Party ID and gender The table shows the 2012 GSS...Ch. 11.3 - Chi-squared versus measuring association For the...Ch. 11.4 - Standardized residuals for happiness and income...Ch. 11.4 - Prob. 36PBCh. 11.4 - Prob. 37PBCh. 11.4 - Prob. 38PBCh. 11.4 - Prob. 39PBCh. 11.4 - Prob. 40PBCh. 11.5 - Keeping old dogs mentally sharp In an experiment...Ch. 11.5 - Prob. 43PBCh. 11.5 - Prob. 44PBCh. 11.5 - Prob. 46PBCh. 11 - Female for president? When recent General Social...Ch. 11 - Prob. 48CPCh. 11 - Down and chi-squared For the data in the previous...Ch. 11 - Prob. 50CPCh. 11 - Prob. 51CPCh. 11 - Prob. 52CPCh. 11 - Prob. 53CPCh. 11 - Prob. 54CPCh. 11 - Prob. 55CPCh. 11 - Prob. 56CPCh. 11 - Seat belt helps? The table refers to passengers in...Ch. 11 - Prob. 58CPCh. 11 - Prob. 59CPCh. 11 - Prob. 60CPCh. 11 - Prob. 61CPCh. 11 - Prob. 62CPCh. 11 - Prob. 63CPCh. 11 - Prob. 64CPCh. 11 - Clarity of diamonds Does the clarity of a diamond...Ch. 11 - Benfords Law When looking at a collection of...Ch. 11 - Prob. 67CPCh. 11 - Prob. 68CPCh. 11 - Prob. 70CPCh. 11 - Prob. 71CPCh. 11 - Prob. 72CPCh. 11 - Prob. 73CPCh. 11 - Prob. 74CPCh. 11 - Prob. 75CPCh. 11 - Prob. 76CPCh. 11 - Prob. 77CPCh. 11 - Prob. 78CPCh. 11 - Prob. 79CPCh. 11 - Statistical versus practical significance In any...Ch. 11 - Prob. 81CPCh. 11 - Multiple response variables Each subject in a...Ch. 11 - Standardized residuals for 2 2 tables The table...Ch. 11 - Prob. 84CPCh. 11 - Prob. 85CPCh. 11 - Prob. 86CPCh. 11 - Prob. 87CPCh. 11 - Prob. 88CPCh. 11 - Voting with 16 A recent survey of Austrian high...
Knowledge Booster


Learn more about
Need a deep-dive on the concept behind this application? Look no further. Learn more about this topic, statistics and related others by exploring similar questions and additional content below.Similar questions
- The details of the clock sales at a supermarket for the past 6 weeks are shown in the table below. The time series appears to be relatively stable, without trend, seasonal, or cyclical effects. The simple moving average value of k is set at 2. If the smoothing constant is assumed to be 0.7, and setting F1 and F2=A1, what is the exponential smoothing sales forecast for week 7? Round to the nearest whole number. Week Units sold 1 88 2 44 3 54 4 65 5 72 6 85 Question content area bottom Part 1 A. 80 clocks B. 60 clocks C. 70 clocks D. 50 clocksarrow_forwardThe details of the clock sales at a supermarket for the past 6 weeks are shown in the table below. The time series appears to be relatively stable, without trend, seasonal, or cyclical effects. The simple moving average value of k is set at 2. Calculate the value of the simple moving average mean absolute percentage error. Round to two decimal places. Week Units sold 1 88 2 44 3 54 4 65 5 72 6 85 Part 1 A. 14.39 B. 25.56 C. 23.45 D. 20.90arrow_forwardThe accompanying data shows the fossil fuels production, fossil fuels consumption, and total energy consumption in quadrillions of BTUs of a certain region for the years 1986 to 2015. Complete parts a and b. Year Fossil Fuels Production Fossil Fuels Consumption Total Energy Consumption1949 28.748 29.002 31.9821950 32.563 31.632 34.6161951 35.792 34.008 36.9741952 34.977 33.800 36.7481953 35.349 34.826 37.6641954 33.764 33.877 36.6391955 37.364 37.410 40.2081956 39.771 38.888 41.7541957 40.133 38.926 41.7871958 37.216 38.717 41.6451959 39.045 40.550 43.4661960 39.869 42.137 45.0861961 40.307 42.758 45.7381962 41.732 44.681 47.8261963 44.037 46.509 49.6441964 45.789 48.543 51.8151965 47.235 50.577 54.0151966 50.035 53.514 57.0141967 52.597 55.127 58.9051968 54.306 58.502 62.4151969 56.286…arrow_forward
- The accompanying data shows the fossil fuels production, fossil fuels consumption, and total energy consumption in quadrillions of BTUs of a certain region for the years 1986 to 2015. Complete parts a and b. Year Fossil Fuels Production Fossil Fuels Consumption Total Energy Consumption1949 28.748 29.002 31.9821950 32.563 31.632 34.6161951 35.792 34.008 36.9741952 34.977 33.800 36.7481953 35.349 34.826 37.6641954 33.764 33.877 36.6391955 37.364 37.410 40.2081956 39.771 38.888 41.7541957 40.133 38.926 41.7871958 37.216 38.717 41.6451959 39.045 40.550 43.4661960 39.869 42.137 45.0861961 40.307 42.758 45.7381962 41.732 44.681 47.8261963 44.037 46.509 49.6441964 45.789 48.543 51.8151965 47.235 50.577 54.0151966 50.035 53.514 57.0141967 52.597 55.127 58.9051968 54.306 58.502 62.4151969 56.286…arrow_forwardThe accompanying data shows the fossil fuels production, fossil fuels consumption, and total energy consumption in quadrillions of BTUs of a certain region for the years 1986 to 2015. Complete parts a and b. Develop line charts for each variable and identify the characteristics of the time series (that is, random, stationary, trend, seasonal, or cyclical). What is the line chart for the variable Fossil Fuels Production?arrow_forwardThe accompanying data shows the fossil fuels production, fossil fuels consumption, and total energy consumption in quadrillions of BTUs of a certain region for the years 1986 to 2015. Complete parts a and b. Year Fossil Fuels Production Fossil Fuels Consumption Total Energy Consumption1949 28.748 29.002 31.9821950 32.563 31.632 34.6161951 35.792 34.008 36.9741952 34.977 33.800 36.7481953 35.349 34.826 37.6641954 33.764 33.877 36.6391955 37.364 37.410 40.2081956 39.771 38.888 41.7541957 40.133 38.926 41.7871958 37.216 38.717 41.6451959 39.045 40.550 43.4661960 39.869 42.137 45.0861961 40.307 42.758 45.7381962 41.732 44.681 47.8261963 44.037 46.509 49.6441964 45.789 48.543 51.8151965 47.235 50.577 54.0151966 50.035 53.514 57.0141967 52.597 55.127 58.9051968 54.306 58.502 62.4151969 56.286…arrow_forward
- For each of the time series, construct a line chart of the data and identify the characteristics of the time series (that is, random, stationary, trend, seasonal, or cyclical). Month PercentApr 1972 4.97May 1972 5.00Jun 1972 5.04Jul 1972 5.25Aug 1972 5.27Sep 1972 5.50Oct 1972 5.73Nov 1972 5.75Dec 1972 5.79Jan 1973 6.00Feb 1973 6.02Mar 1973 6.30Apr 1973 6.61May 1973 7.01Jun 1973 7.49Jul 1973 8.30Aug 1973 9.23Sep 1973 9.86Oct 1973 9.94Nov 1973 9.75Dec 1973 9.75Jan 1974 9.73Feb 1974 9.21Mar 1974 8.85Apr 1974 10.02May 1974 11.25Jun 1974 11.54Jul 1974 11.97Aug 1974 12.00Sep 1974 12.00Oct 1974 11.68Nov 1974 10.83Dec 1974 10.50Jan 1975 10.05Feb 1975 8.96Mar 1975 7.93Apr 1975 7.50May 1975 7.40Jun 1975 7.07Jul 1975 7.15Aug 1975 7.66Sep 1975 7.88Oct 1975 7.96Nov 1975 7.53Dec 1975 7.26Jan 1976 7.00Feb 1976 6.75Mar 1976 6.75Apr 1976 6.75May 1976…arrow_forwardHi, I need to make sure I have drafted a thorough analysis, so please answer the following questions. Based on the data in the attached image, develop a regression model to forecast the average sales of football magazines for each of the seven home games in the upcoming season (Year 10). That is, you should construct a single regression model and use it to estimate the average demand for the seven home games in Year 10. In addition to the variables provided, you may create new variables based on these variables or based on observations of your analysis. Be sure to provide a thorough analysis of your final model (residual diagnostics) and provide assessments of its accuracy. What insights are available based on your regression model?arrow_forwardI want to make sure that I included all possible variables and observations. There is a considerable amount of data in the images below, but not all of it may be useful for your purposes. Are there variables contained in the file that you would exclude from a forecast model to determine football magazine sales in Year 10? If so, why? Are there particular observations of football magazine sales from previous years that you would exclude from your forecasting model? If so, why?arrow_forward
- Stat questionsarrow_forward1) and let Xt is stochastic process with WSS and Rxlt t+t) 1) E (X5) = \ 1 2 Show that E (X5 = X 3 = 2 (= = =) Since X is WSSEL 2 3) find E(X5+ X3)² 4) sind E(X5+X2) J=1 ***arrow_forwardProve that 1) | RxX (T) | << = (R₁ " + R$) 2) find Laplalse trans. of Normal dis: 3) Prove thy t /Rx (z) | < | Rx (0)\ 4) show that evary algebra is algebra or not.arrow_forward
arrow_back_ios
SEE MORE QUESTIONS
arrow_forward_ios
Recommended textbooks for you
 Glencoe Algebra 1, Student Edition, 9780079039897...AlgebraISBN:9780079039897Author:CarterPublisher:McGraw Hill
 College Algebra (MindTap Course List)AlgebraISBN:9781305652231Author:R. David Gustafson, Jeff HughesPublisher:Cengage Learning
 Holt Mcdougal Larson Pre-algebra: Student Edition...AlgebraISBN:9780547587776Author:HOLT MCDOUGALPublisher:HOLT MCDOUGAL
 Big Ideas Math A Bridge To Success Algebra 1: Stu...AlgebraISBN:9781680331141Author:HOUGHTON MIFFLIN HARCOURTPublisher:Houghton Mifflin Harcourt
Glencoe Algebra 1, Student Edition, 9780079039897...
Algebra
ISBN:9780079039897
Author:Carter
Publisher:McGraw Hill
College Algebra (MindTap Course List)
Algebra
ISBN:9781305652231
Author:R. David Gustafson, Jeff Hughes
Publisher:Cengage Learning
Holt Mcdougal Larson Pre-algebra: Student Edition...
Algebra
ISBN:9780547587776
Author:HOLT MCDOUGAL
Publisher:HOLT MCDOUGAL
Big Ideas Math A Bridge To Success Algebra 1: Stu...
Algebra
ISBN:9781680331141
Author:HOUGHTON MIFFLIN HARCOURT
Publisher:Houghton Mifflin Harcourt
Hypothesis Testing using Confidence Interval Approach; Author: BUM2413 Applied Statistics UMP;https://www.youtube.com/watch?v=Hq1l3e9pLyY;License: Standard YouTube License, CC-BY
Hypothesis Testing - Difference of Two Means - Student's -Distribution & Normal Distribution; Author: The Organic Chemistry Tutor;https://www.youtube.com/watch?v=UcZwyzwWU7o;License: Standard Youtube License