Videos
Effect of Paternal Grandmother's Food Supply on Infant Mortality Widely available historical data on periods of famine show that before the industrial revolution, a failed harvest in one autumn often led to severe food shortages the following winter. Retrospective studies have correlated infant mortality with the abundance or food during a grandparent's child hood. FIGURE 10.11 shows results from one or these studies.
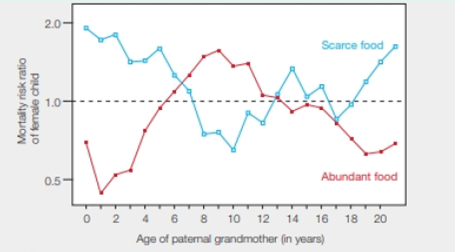
FIGURE 10.11 Relative risk of early death of female child, correlated with the age at which her paternal grandmother experienced a winter with a food supply, that was scarce (blue) or abundant (red) during childhood. The dotted line represents no difference in risk of mortality. A value above the line means increased risk; one below the line indicates reduced risk.
Compare the mortality risk of girls whose paternal grandmothers ate well at age 2 with girls whose grandmothers experienced famine at the same age. Which girl was more likely to die early? How much more likely was she to die?
To compare: The mortality risk of girls with the food habit of their parental grandmothers.
Introduction: The parental eating behavior has a great influence on the mortality rate of the offspring. The survival of the humans is greatly affected by the food scarcity faced by their ancestors. An individual who has faced famine or starvation at a particular period can be correlated with the infant mortality rate.
Explanation of Solution
As given in Fig. 10.11, “Relative risk of early death of a female child” can be correlated with the age of her parental grandmother food scarcity or food abundance.
According to the given data, during the industrial revolution, a food shortage was experienced in winter due to the failure in harvesting in the autumn season.
The given graph shows, the age of parental grandmother in X- axis and mortality risk ratio of the female child in the Y- axis. The blue line in the graph depicts the mortality rate and parental grandmother who faced food scarcity at the different age. And the red line in the graph depicts the mortality rate and parental grandmother who has abundant of food at the different age. A dotted line which given in the graph represents that there is no difference in the risk of mortality. If the value goes above the dotted line, the risk increases and value below the line the risk decreases.
A comparison is done between the mortality risks of girls correlated with the eating habits of their parental grandmother at the age 2. According to the given graph, a girl whose grandmother experienced food crisis at the age of two is more likely to die earlier than the girl whose parental grandmother got abundant food at the age of 2. The female grandchild’s mortality risk ratio is one and one and half time greater than the average.
The girl child whose parental grandmother faced food crisis at age 2 is one and one-half times more likely to die early.
Want to see more full solutions like this?
Chapter 10 Solutions
Biology: The Unity and Diversity of Life (MindTap Course List)
Additional Science Textbook Solutions
SEELEY'S ANATOMY+PHYSIOLOGY
Genetics: From Genes to Genomes
Campbell Essential Biology (7th Edition)
HUMAN ANATOMY
Microbiology Fundamentals: A Clinical Approach


- What is a gain of function mutation?arrow_forwardMolecular Biology Question: Please help. Thank you Is Southern hybridization's purpose detecting specific nucleotide sequences? How so?arrow_forwardUse the following information to answer the question(s) below. Martin Wikelski and L. Michael Romero (Body size, performance and fitness in Galápagos marine iguanas, Integrative and Comparative Biology 43 [2003]:376-86) measured the snout-to-vent (anus) length of Galápagos marine iguanas and observed the percent survival of different-sized animals, all of the same age. The graph shows the log snout-vent length (SVL, a measure of overall body size) plotted against the percent survival of these different size classes for males and females. Survival (%) 100- 80- 60- 40- 20- 0+ 1.9 T 2 2.1 2.2 2.3 2.4 2.5 2.6 2.7 Log SVL (mm) 19) Examine the figure above. What type of selection for body size appears to be occurring in these marine iguanas? A) directional selection B) stabilizing selection C) disruptive selection D) You cannot determine the type of selection from the above information. 3arrow_forward
- 24) Use the following information to answer the question below. Researchers studying a small milkweed population note that some plants produce a toxin and other plants do not. They identify the gene responsible for toxin production. The dominant allele (T) codes for an enzyme that makes the toxin, and the recessive allele (t) codes for a nonfunctional enzyme that cannot produce the toxin. Heterozygotes produce an intermediate amount of toxin. The genotypes of all individuals in the population are determined (see table) and used to determine the actual allele frequencies in the population. TT 0.49 Tt 0.42 tt 0.09 Refer to the table above. Is this population in Hardy-Weinberg equilibrium? A) Yes. C) No; there are more homozygotes than expected. B) No; there are more heterozygotes than expected. D) It is impossible to tell.arrow_forward30) A B CDEFG Refer to the accompanying figure. Which of the following forms a monophyletic group? A) A, B, C, and D B) C and D C) D, E, and F D) E, F, and Garrow_forwardMolecular Biology Question. Please help with step solution and explanation. Thank you: The Polymerase Chain Reaction (PCR) reaction consists of three steps denaturation, hybridization, and elongation. Please describe what occurs in the annealing step of the PCR reaction. (I think annealing step is hybridization). What are the other two steps of PCR, and what are their functions? Next, suppose the Tm for the two primers being used are 54C for Primer A and 67C for Primer B. Regarding annealing step temperature, I have the following choices for the temperature used during the annealing step:(a) 43C (b) 49C (c) 62C (d) 73C Which temperature/temperatures should I choose? What is the corresponding correct explanation, and why would I not use the other temperatures? Have a good day!arrow_forward
- Using the data provided on the mean body mass and horn size of 4-year-old male sheep, draw a scatterplot graph to examine how body mass and horn size changed over time.arrow_forwardPlease write a 500-word report about the intake of saturated fat, sodium, alcoholic beverages, or added sugar in America. Choose ONE of these and write about what is recommended by the Dietary Guidelines for Americans (guideline #4) and why Americans exceed the intake of that nutrient. Explain what we could do as a society and/or individuals to reduce our intake of your chosen nutrient.arrow_forwardWrite a 500-word report indicating how you can change the quantity or quality of TWO nutrients where your intake was LOWER than what is recommended by the Dietary Guidelines for Americans and/or the DRIs. Indicate how the lack of the nutrient may affect your health. For full credit, all of the following points must be addressed and elaborated on in more detail for each nutrient: The name of the nutrient At least 2 main functions of the nutrient (example: “Vitamin D regulates calcium levels in the blood and calcification of bones.”) Your percent intake compared to the RDA/DRI (example “I consumed 50% of the RDA for vitamin D”) Indicate why your intake was below the recommendations (example: “I only had one serving of dairy products and that was why I was below the recommendations for vitamin D”) How would you change your dietary pattern to meet the recommendations? – be sure to list specific foods (example: “I would add a yogurt and a glass of milk to each day in order to increase my…arrow_forward
- Why are nutrient absorption and dosage levels important when taking multivitamins and vitamin and mineral supplements?arrow_forwardI'm struggling with this topic and would really appreciate your help. I need to hand-draw a diagram and explain the process of sexual differentiation in humans, including structures, hormones, enzymes, and other details. Could you also make sure to include these terms in the explanation? . Gonads . Wolffian ducts • Müllerian ducts . ⚫ Testes . Testosterone • Anti-Müllerian Hormone (AMH) . Epididymis • Vas deferens ⚫ Seminal vesicles ⚫ 5-alpha reductase ⚫ DHT - Penis . Scrotum . Ovaries • Uterus ⚫ Fallopian tubes - Vagina - Clitoris . Labia Thank you so much for your help!arrow_forwardRequisition Exercise A phlebotomist goes to a patient’s room with the following requisition. Hometown Hospital USA 125 Goodcare Avenue Small Town, USAarrow_forward
 Understanding Nutrition (MindTap Course List)Health & NutritionISBN:9781337392693Author:Eleanor Noss Whitney, Sharon Rady RolfesPublisher:Cengage Learning
 Nutrition Through The Life CycleHealth & NutritionISBN:9781337919333Author:Brown, Judith E.Publisher:Cengage Learning,
 Biology: The Unity and Diversity of Life (MindTap...BiologyISBN:9781305073951Author:Cecie Starr, Ralph Taggart, Christine Evers, Lisa StarrPublisher:Cengage Learning
 Biology: The Dynamic Science (MindTap Course List)BiologyISBN:9781305389892Author:Peter J. Russell, Paul E. Hertz, Beverly McMillanPublisher:Cengage Learning
 Biology Today and Tomorrow without Physiology (Mi...BiologyISBN:9781305117396Author:Cecie Starr, Christine Evers, Lisa StarrPublisher:Cengage Learning