
Introductory Statistics
1st Edition
ISBN: 9781938168208
Author: Barbara Illowsky, Susan Dean
Publisher: OpenStax College
expand_more
expand_more
format_list_bulleted
Videos
Textbook Question
Chapter 1, Problem 88H
An advertisement for Acme Investments displays the two graphs in Figure 1.14 to show the value of Acme’s product in comparison with the Other Guy’s product. Describe the potentially misleading visual effect of these comparison graphs. How can this be corrected?
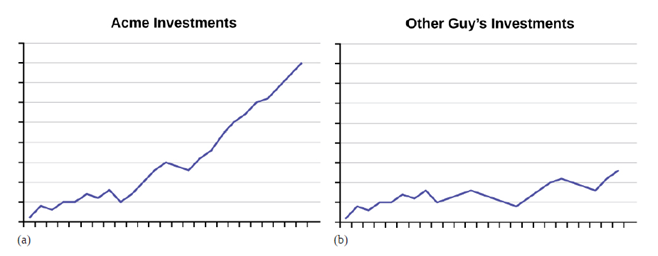 Figure 1.14 As the graphs show. Acme consistently outperforms the Other Guys!
Expert Solution & Answer

Trending nowThis is a popular solution!

Students have asked these similar questions
«
CENGAGE MINDTAP
Quiz: Chapter 38
Assignment: Quiz: Chapter 38
ips
Questions ra1kw08h_ch38.15m
13.
14.
15.
O
Which sentence has modifiers in the correct place?
O a. When called, she for a medical emergency responds quickly.
b. Without giving away too much of the plot, Helena described the heroine's actions in the film.
O c. Nearly the snakebite victim died before the proper antitoxin was injected.
. O
O
16
16.
O
17.
18.
O
19.
O
20
20.
21
21.
22.
22
DS
23.
23
24.
25.
O
O
O
Questions ra1kw08h_ch36.14m
12.
13.
14.
15.
16.
Ӧ
17.
18.
19.
OS
20.
Two separate sentences need
Oa. two separate subjects.
Ob. two dependent clauses.
c. one shared subject.
Customers experiencing technical difficulty with their Internet cable service may call an 800 number for technical support. It takes the technician between 30 seconds and 11 minutes to resolve the problem. The distribution of this support time follows the uniform distribution.
Required:
a. What are the values for a and b in minutes?
Note: Do not round your intermediate calculations. Round your answers to 1 decimal place.
b-1. What is the mean time to resolve the problem?
b-2. What is the standard deviation of the time?
c. What percent of the problems take more than 5 minutes to resolve?
d. Suppose we wish to find the middle 50% of the problem-solving times. What are the end points of these two times?
Chapter 1 Solutions
Introductory Statistics
Ch. 1 - Determine what the key terms refer to in the...Ch. 1 - The data are the number of machines in a gym. You...Ch. 1 - The data are the areas of Lawns in square feet....Ch. 1 - The data are the colors of houses. You sample five...Ch. 1 - Determine the correct data type (quantitative or...Ch. 1 - The registrar at State University keeps records of...Ch. 1 - You are going to use the random number generator...Ch. 1 - Determine the type of sampling used (simple...Ch. 1 - A local radio station has a fan base of 20,000...Ch. 1 - Table 1.13 shows the amount, in inches, of annual...
Ch. 1 - From Table 1.13, find the percentage of rainfall...Ch. 1 - From Table 1.13, find the number of towns that...Ch. 1 - Table 1.13 represents the amount, in inches, of...Ch. 1 - Table 1.16 contains the total number of fatal...Ch. 1 - You are concerned about the effects of texting on...Ch. 1 - Describe the unethical behavior, if any, in each...Ch. 1 - Determine that the key terms refer to in the...Ch. 1 - Determine that the key terms refer to in the...Ch. 1 - Determine that the key terms refer to in the...Ch. 1 - Determine that the key terms refer to in the...Ch. 1 - Determine that the key terms refer to in the...Ch. 1 - “Number of times per week” Is what type of data?...Ch. 1 - The sampling method was a. simple random; b....Ch. 1 - “Duration (amount of time)” is what type of data?...Ch. 1 - The colors of the houses around the park are what...Ch. 1 - The population is ________Ch. 1 - Table 1.26 contains the total number of deaths...Ch. 1 - For the f1onwing four exercises, determine the...Ch. 1 - For the f1onwing four exercises, determine the...Ch. 1 - For the f1onwing four exercises, determine the...Ch. 1 - For the f1onwing four exercises, determine the...Ch. 1 - Use the following information to answer the next...Ch. 1 - Use the following information to answer the next...Ch. 1 - Use the following information to answer the next...Ch. 1 - Use the following information to answer the next...Ch. 1 - Use the following information to answer the next...Ch. 1 - Use the following information to answer the next...Ch. 1 - Use the following information to answer the next...Ch. 1 - Use the following information to answer the next...Ch. 1 - Use the following data to answer the next five...Ch. 1 - Use the following data to answer the next five...Ch. 1 - Use the following data to answer the next five...Ch. 1 - Use the following data to answer the next five...Ch. 1 - Use the following data to answer the next five...Ch. 1 - Use the following data to answer the next five...Ch. 1 - Use the following data to answer the next five...Ch. 1 - Use the following data to answer the next five...Ch. 1 - Use the following data to answer the next five...Ch. 1 - Use the following data to answer the next five...Ch. 1 - Is a sample size of 1,000 a reliable measure for a...Ch. 1 - Is a sample of 500 volunteers a reliable measure...Ch. 1 - A question on a survey reads: “Do you prefer the...Ch. 1 - Is a sample size of two representative of a...Ch. 1 - Is it possible for two experiments to be well run...Ch. 1 - What type of measure scale is being used? Nominal,...Ch. 1 - Design an experiment. Identify the explanatory and...Ch. 1 - Discuss potential violations of the rule requiring...Ch. 1 - For each of the following eight exercises,...Ch. 1 - For each of the following eight exercises,...Ch. 1 - For each of the following eight exercises,...Ch. 1 - For each of the following eight exercises,...Ch. 1 - For each of the following eight exercises,...Ch. 1 - For each of the following eight exercises,...Ch. 1 - For each of the following eight exercises,...Ch. 1 - For each of the following eight exercises,...Ch. 1 - Use the following information to answer the next...Ch. 1 - Use the following information to answer the next...Ch. 1 - Use the following information to answer the next...Ch. 1 - For the following exercises, identify (he type of...Ch. 1 - For the following exercises, identify (he type of...Ch. 1 - For the following exercises, identify (he type of...Ch. 1 - For the following exercises, identify (he type of...Ch. 1 - For the following exercises, identify (he type of...Ch. 1 - For the following exercises, identify (he type of...Ch. 1 - For the following exercises, identify (he type of...Ch. 1 - For the following exercises, identify (he type of...Ch. 1 - For the following exercises, identify (he type of...Ch. 1 - For the following exercises, identify (he type of...Ch. 1 - Use the following information to answer the next...Ch. 1 - Use the following information to answer the next...Ch. 1 - Airline companies are interested in the...Ch. 1 - Suppose you want to determine the mean number of...Ch. 1 - Suppose you want to determine the mean number of...Ch. 1 - List some practical difficulties involved in...Ch. 1 - List some practical difficulties involved in...Ch. 1 - With your classmates, brainstorm some ways you...Ch. 1 - The instructor takes her sample by gathering data...Ch. 1 - A study was done to determine the age, number of...Ch. 1 - Name the sampling method used in each of the...Ch. 1 - A “random survey” was conducted of 3,2’4 people of...Ch. 1 - The Well-Being Index is a survey that follows...Ch. 1 - In advance of the 1936 Presidential Election, a...Ch. 1 - Crime-related and demographic statistics for 4 US...Ch. 1 - YouPolls is a website that allows anyone to create...Ch. 1 - A scholarly article about response rates begins...Ch. 1 - Fifty part-time students were asked how many...Ch. 1 - Sixty adults with gum disease were asked the...Ch. 1 - Nineteen immigrants to the U.S were asked how many...Ch. 1 - How much time does it take to navel to work? Table...Ch. 1 - Forbes magazine published data on the best small...Ch. 1 - Use (he following information o answer the next...Ch. 1 - Use (he following information o answer the next...Ch. 1 - How does sleep deprivation affect your ability to...Ch. 1 - An advertisement for Acme Investments displays the...Ch. 1 - The graph in Figure 1.15 shows the number of...Ch. 1 - Seven hundred and Seventy-one distance learning...Ch. 1 - Several online textbook retailers advertise that...
Additional Math Textbook Solutions
Find more solutions based on key concepts
A categorical variable has three categories, with the following frequencies of occurrence: a. Compute the perce...
Basic Business Statistics, Student Value Edition
A pair of fair dice is rolled. What is the probability that the second die lands on a higher value than does th...
A First Course in Probability (10th Edition)
Time Employed A human resources manager for a large company takes a random sample of 50 employees from the comp...
Introductory Statistics
TRY IT YOURSELF 1
Find the mean of the points scored by the 51 winning teams listed on page 39.
Elementary Statistics: Picturing the World (7th Edition)
Derivatives of Logarithms
In Exercises 11–40, find the derivative of y with respect to x, t, or θ, as appropria...
University Calculus: Early Transcendentals (4th Edition)
Find how many SDs above the mean price would be predicted to cost.
Intro Stats, Books a la Carte Edition (5th Edition)
Knowledge Booster


Learn more about
Need a deep-dive on the concept behind this application? Look no further. Learn more about this topic, statistics and related others by exploring similar questions and additional content below.Similar questions
- Exercise 6-6 (Algo) (LO6-3) The director of admissions at Kinzua University in Nova Scotia estimated the distribution of student admissions for the fall semester on the basis of past experience. Admissions Probability 1,100 0.5 1,400 0.4 1,300 0.1 Click here for the Excel Data File Required: What is the expected number of admissions for the fall semester? Compute the variance and the standard deviation of the number of admissions. Note: Round your standard deviation to 2 decimal places.arrow_forward1. Find the mean of the x-values (x-bar) and the mean of the y-values (y-bar) and write/label each here: 2. Label the second row in the table using proper notation; then, complete the table. In the fifth and sixth columns, show the 'products' of what you're multiplying, as well as the answers. X y x minus x-bar y minus y-bar (x minus x-bar)(y minus y-bar) (x minus x-bar)^2 xy 16 20 34 4-2 5 2 3. Write the sums that represents Sxx and Sxy in the table, at the bottom of their respective columns. 4. Find the slope of the Regression line: bi = (simplify your answer) 5. Find the y-intercept of the Regression line, and then write the equation of the Regression line. Show your work. Then, BOX your final answer. Express your line as "y-hat equals...arrow_forwardApply STATA commands & submit the output for each question only when indicated below i. Generate the log of birthweight and family income of children. Name these new variables Ibwght & Ifaminc. Include the output of this code. ii. Apply the command sum with the detail option to the variable faminc. Note: you should find the 25th percentile value, the 50th percentile and the 75th percentile value of faminc from the output - you will need it to answer the next question Include the output of this code. iii. iv. Use the output from part ii of this question to Generate a variable called "high_faminc" that takes a value 1 if faminc is less than or equal to the 25th percentile, it takes the value 2 if faminc is greater than 25th percentile but less than or equal to the 50th percentile, it takes the value 3 if faminc is greater than 50th percentile but less than or equal to the 75th percentile, it takes the value 4 if faminc is greater than the 75th percentile. Include the outcome of this code…arrow_forward
- solve this on paperarrow_forwardApply STATA commands & submit the output for each question only when indicated below i. Apply the command egen to create a variable called "wyd" which is the rowtotal function on variables bwght & faminc. ii. Apply the list command for the first 10 observations to show that the code in part i worked. Include the outcome of this code iii. Apply the egen command to create a new variable called "bwghtsum" using the sum function on variable bwght by the variable high_faminc (Note: need to apply the bysort' statement) iv. Apply the "by high_faminc" statement to find the V. descriptive statistics of bwght and bwghtsum Include the output of this code. Why is there a difference between the standard deviations of bwght and bwghtsum from part iv of this question?arrow_forwardAccording to a health information website, the distribution of adults’ diastolic blood pressure (in millimeters of mercury, mmHg) can be modeled by a normal distribution with mean 70 mmHg and standard deviation 20 mmHg. b. Above what diastolic pressure would classify someone in the highest 1% of blood pressures? Show all calculations used.arrow_forward
- Write STATA codes which will generate the outcomes in the questions & submit the output for each question only when indicated below i. ii. iii. iv. V. Write a code which will allow STATA to go to your favorite folder to access your files. Load the birthweight1.dta dataset from your favorite folder and save it under a different filename to protect data integrity. Call the new dataset babywt.dta (make sure to use the replace option). Verify that it contains 2,998 observations and 8 variables. Include the output of this code. Are there missing observations for variable(s) for the variables called bwght, faminc, cigs? How would you know? (You may use more than one code to show your answer(s)) Include the output of your code (s). Write the definitions of these variables: bwght, faminc, male, white, motheduc,cigs; which of these variables are categorical? [Hint: use the labels of the variables & the browse command] Who is this dataset about? Who can use this dataset to answer what kind of…arrow_forwardApply STATA commands & submit the output for each question only when indicated below İ. ii. iii. iv. V. Apply the command summarize on variables bwght and faminc. What is the average birthweight of babies and family income of the respondents? Include the output of this code. Apply the tab command on the variable called male. How many of the babies and what share of babies are male? Include the output of this code. Find the summary statistics (i.e. use the sum command) of the variables bwght and faminc if the babies are white. Include the output of this code. Find the summary statistics (i.e. use the sum command) of the variables bwght and faminc if the babies are male but not white. Include the output of this code. Using your answers to previous subparts of this question: What is the difference between the average birthweight of a baby who is male and a baby who is male but not white? What can you say anything about the difference in family income of the babies that are male and male…arrow_forwardA public health researcher is studying the impacts of nudge marketing techniques on shoppers vegetablesarrow_forward
- The director of admissions at Kinzua University in Nova Scotia estimated the distribution of student admissions for the fall semester on the basis of past experience. Admissions Probability 1,100 0.5 1,400 0.4 1,300 0.1 Click here for the Excel Data File Required: What is the expected number of admissions for the fall semester? Compute the variance and the standard deviation of the number of admissions. Note: Round your standard deviation to 2 decimal places.arrow_forwardA pollster randomly selected four of 10 available people. Required: How many different groups of 4 are possible? What is the probability that a person is a member of a group? Note: Round your answer to 3 decimal places.arrow_forwardWind Mountain is an archaeological study area located in southwestern New Mexico. Potsherds are broken pieces of prehistoric Native American clay vessels. One type of painted ceramic vessel is called Mimbres classic black-on-white. At three different sites the number of such sherds was counted in local dwelling excavations. Test given. Site I Site II Site III 63 19 60 43 34 21 23 49 51 48 11 15 16 46 26 20 31 Find .arrow_forward
arrow_back_ios
SEE MORE QUESTIONS
arrow_forward_ios
Recommended textbooks for you
 Glencoe Algebra 1, Student Edition, 9780079039897...AlgebraISBN:9780079039897Author:CarterPublisher:McGraw Hill
 Algebra for College StudentsAlgebraISBN:9781285195780Author:Jerome E. Kaufmann, Karen L. SchwittersPublisher:Cengage Learning
Glencoe Algebra 1, Student Edition, 9780079039897...
Algebra
ISBN:9780079039897
Author:Carter
Publisher:McGraw Hill
Algebra for College Students
Algebra
ISBN:9781285195780
Author:Jerome E. Kaufmann, Karen L. Schwitters
Publisher:Cengage Learning
2.1 Introduction to inequalities; Author: Oli Notes;https://www.youtube.com/watch?v=D6erN5YTlXE;License: Standard YouTube License, CC-BY
GCSE Maths - What are Inequalities? (Inequalities Part 1) #56; Author: Cognito;https://www.youtube.com/watch?v=e_tY6X5PwWw;License: Standard YouTube License, CC-BY
Introduction to Inequalities | Inequality Symbols | Testing Solutions for Inequalities; Author: Scam Squad Math;https://www.youtube.com/watch?v=paZSN7sV1R8;License: Standard YouTube License, CC-BY