Use the following data to answer the next five exercises: A pair of studies was performed to measure the effectiveness of a new software program designed to help stroke patients regain their problem-solving skills. Patients were asked to use the software program twice a day, once in the morning and once in the evening. The studies observed 200 stroke patients recovering over a period of several weeks. The first study collected the data in Table 1.31. The second study collected the data in Table 1.32. 29. Given what you know, which study is correct?
Use the following data to answer the next five exercises: A pair of studies was performed to measure the effectiveness of a new software program designed to help stroke patients regain their problem-solving skills. Patients were asked to use the software program twice a day, once in the morning and once in the evening. The studies observed 200 stroke patients recovering over a period of several weeks. The first study collected the data in Table 1.31. The second study collected the data in Table 1.32. 29. Given what you know, which study is correct?
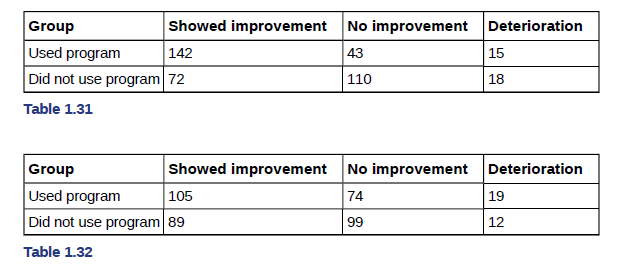
Use the following data to answer the next five exercises: A pair of studies was performed to measure the effectiveness of a new software program designed to help stroke patients regain their problem-solving skills. Patients were asked to use the software program twice a day, once in the morning and once in the evening. The studies observed 200 stroke patients recovering over a period of several weeks. The first study collected the data in Table 1.31. The second study collected the data in Table 1.32.
Find the critical value for a left-tailed test using the F distribution with a 0.025, degrees of freedom in the numerator=12, and degrees of freedom in the
denominator = 50. A portion of the table of critical values of the F-distribution is provided.
Click the icon to view the partial table of critical values of the F-distribution.
What is the critical value?
(Round to two decimal places as needed.)
A retail store manager claims that the average daily sales of the store are $1,500.
You aim to test whether the actual average daily sales differ significantly from this claimed value.
You can provide your answer by inserting a text box and the answer must include:
Null hypothesis,
Alternative hypothesis,
Show answer (output table/summary table), and
Conclusion based on the P value.
Showing the calculation is a must. If calculation is missing,so please provide a step by step on the answers
Numerical answers in the yellow cells
Elementary Statistics: Picturing the World (7th Edition)
Knowledge Booster
Learn more about
Need a deep-dive on the concept behind this application? Look no further. Learn more about this topic, statistics and related others by exploring similar questions and additional content below.
Linear Equation | Solving Linear Equations | What is Linear Equation in one variable ?; Author: Najam Academy;https://www.youtube.com/watch?v=tHm3X_Ta_iE;License: Standard YouTube License, CC-BY


 Glencoe Algebra 1, Student Edition, 9780079039897...AlgebraISBN:9780079039897Author:CarterPublisher:McGraw Hill
 Holt Mcdougal Larson Pre-algebra: Student Edition...AlgebraISBN:9780547587776Author:HOLT MCDOUGALPublisher:HOLT MCDOUGAL
 Big Ideas Math A Bridge To Success Algebra 1: Stu...AlgebraISBN:9781680331141Author:HOUGHTON MIFFLIN HARCOURTPublisher:Houghton Mifflin Harcourt
 Functions and Change: A Modeling Approach to Coll...AlgebraISBN:9781337111348Author:Bruce Crauder, Benny Evans, Alan NoellPublisher:Cengage Learning
 College Algebra (MindTap Course List)AlgebraISBN:9781305652231Author:R. David Gustafson, Jeff HughesPublisher:Cengage Learning