
Introductory Statistics
1st Edition
ISBN: 9781938168208
Author: Barbara Illowsky, Susan Dean
Publisher: OpenStax College
expand_more
expand_more
format_list_bulleted
Videos
Textbook Question
Chapter 1, Problem 28P
Use the following data to answer the next five exercises: Two researchers are gathering data on hours of video games played by school-aged children and young adults. They each randomly sample different groups of 150 students from the same school. They collect the following data.
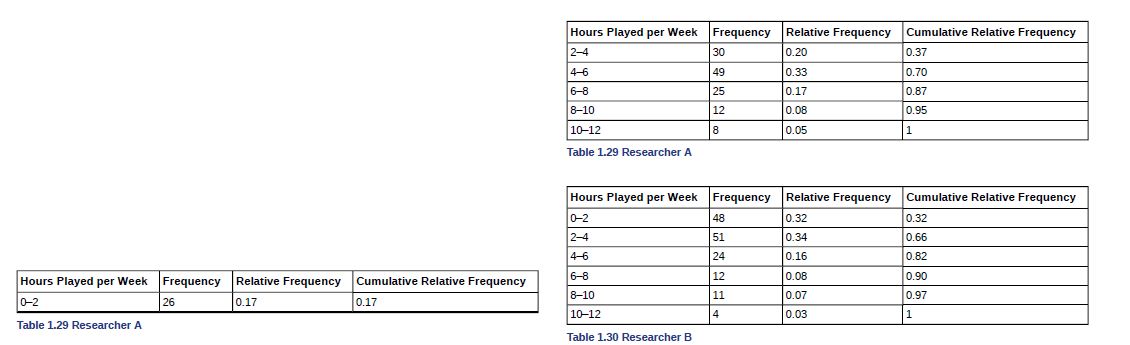
28. As part of a way to reward students for participating in the survey, the researchers gave each student a gift card to a video game store. Would this affect the data if students knew about the award before the stud?
Expert Solution & Answer
Want to see the full answer?
Check out a sample textbook solution
Students have asked these similar questions
What is the solution and answer to question?
To: [Boss's Name]
From: Nathaniel D Sain
Date: 4/5/2025
Subject: Decision Analysis for Business Scenario
Introduction to the Business Scenario
Our delivery services business has been experiencing steady growth, leading to an
increased demand for faster and more efficient deliveries. To meet this demand,
we must decide on the best strategy to expand our fleet. The three possible
alternatives under consideration are purchasing new delivery vehicles, leasing
vehicles, or partnering with third-party drivers. The decision must account for
various external factors, including fuel price fluctuations, demand stability, and
competition growth, which we categorize as the states of nature. Each alternative
presents unique advantages and challenges, and our goal is to select the most
viable option using a structured decision-making approach.
Alternatives and States of Nature
The three alternatives for fleet expansion were chosen based on their cost
implications, operational efficiency, and…
Business
Chapter 1 Solutions
Introductory Statistics
Ch. 1 - Determine what the key terms refer to in the...Ch. 1 - The data are the number of machines in a gym. You...Ch. 1 - The data are the areas of Lawns in square feet....Ch. 1 - The data are the colors of houses. You sample five...Ch. 1 - Determine the correct data type (quantitative or...Ch. 1 - The registrar at State University keeps records of...Ch. 1 - You are going to use the random number generator...Ch. 1 - Determine the type of sampling used (simple...Ch. 1 - A local radio station has a fan base of 20,000...Ch. 1 - Table 1.13 shows the amount, in inches, of annual...
Ch. 1 - From Table 1.13, find the percentage of rainfall...Ch. 1 - From Table 1.13, find the number of towns that...Ch. 1 - Table 1.13 represents the amount, in inches, of...Ch. 1 - Table 1.16 contains the total number of fatal...Ch. 1 - You are concerned about the effects of texting on...Ch. 1 - Describe the unethical behavior, if any, in each...Ch. 1 - Determine that the key terms refer to in the...Ch. 1 - Determine that the key terms refer to in the...Ch. 1 - Determine that the key terms refer to in the...Ch. 1 - Determine that the key terms refer to in the...Ch. 1 - Determine that the key terms refer to in the...Ch. 1 - “Number of times per week” Is what type of data?...Ch. 1 - The sampling method was a. simple random; b....Ch. 1 - “Duration (amount of time)” is what type of data?...Ch. 1 - The colors of the houses around the park are what...Ch. 1 - The population is ________Ch. 1 - Table 1.26 contains the total number of deaths...Ch. 1 - For the f1onwing four exercises, determine the...Ch. 1 - For the f1onwing four exercises, determine the...Ch. 1 - For the f1onwing four exercises, determine the...Ch. 1 - For the f1onwing four exercises, determine the...Ch. 1 - Use the following information to answer the next...Ch. 1 - Use the following information to answer the next...Ch. 1 - Use the following information to answer the next...Ch. 1 - Use the following information to answer the next...Ch. 1 - Use the following information to answer the next...Ch. 1 - Use the following information to answer the next...Ch. 1 - Use the following information to answer the next...Ch. 1 - Use the following information to answer the next...Ch. 1 - Use the following data to answer the next five...Ch. 1 - Use the following data to answer the next five...Ch. 1 - Use the following data to answer the next five...Ch. 1 - Use the following data to answer the next five...Ch. 1 - Use the following data to answer the next five...Ch. 1 - Use the following data to answer the next five...Ch. 1 - Use the following data to answer the next five...Ch. 1 - Use the following data to answer the next five...Ch. 1 - Use the following data to answer the next five...Ch. 1 - Use the following data to answer the next five...Ch. 1 - Is a sample size of 1,000 a reliable measure for a...Ch. 1 - Is a sample of 500 volunteers a reliable measure...Ch. 1 - A question on a survey reads: “Do you prefer the...Ch. 1 - Is a sample size of two representative of a...Ch. 1 - Is it possible for two experiments to be well run...Ch. 1 - What type of measure scale is being used? Nominal,...Ch. 1 - Design an experiment. Identify the explanatory and...Ch. 1 - Discuss potential violations of the rule requiring...Ch. 1 - For each of the following eight exercises,...Ch. 1 - For each of the following eight exercises,...Ch. 1 - For each of the following eight exercises,...Ch. 1 - For each of the following eight exercises,...Ch. 1 - For each of the following eight exercises,...Ch. 1 - For each of the following eight exercises,...Ch. 1 - For each of the following eight exercises,...Ch. 1 - For each of the following eight exercises,...Ch. 1 - Use the following information to answer the next...Ch. 1 - Use the following information to answer the next...Ch. 1 - Use the following information to answer the next...Ch. 1 - For the following exercises, identify (he type of...Ch. 1 - For the following exercises, identify (he type of...Ch. 1 - For the following exercises, identify (he type of...Ch. 1 - For the following exercises, identify (he type of...Ch. 1 - For the following exercises, identify (he type of...Ch. 1 - For the following exercises, identify (he type of...Ch. 1 - For the following exercises, identify (he type of...Ch. 1 - For the following exercises, identify (he type of...Ch. 1 - For the following exercises, identify (he type of...Ch. 1 - For the following exercises, identify (he type of...Ch. 1 - Use the following information to answer the next...Ch. 1 - Use the following information to answer the next...Ch. 1 - Airline companies are interested in the...Ch. 1 - Suppose you want to determine the mean number of...Ch. 1 - Suppose you want to determine the mean number of...Ch. 1 - List some practical difficulties involved in...Ch. 1 - List some practical difficulties involved in...Ch. 1 - With your classmates, brainstorm some ways you...Ch. 1 - The instructor takes her sample by gathering data...Ch. 1 - A study was done to determine the age, number of...Ch. 1 - Name the sampling method used in each of the...Ch. 1 - A “random survey” was conducted of 3,2’4 people of...Ch. 1 - The Well-Being Index is a survey that follows...Ch. 1 - In advance of the 1936 Presidential Election, a...Ch. 1 - Crime-related and demographic statistics for 4 US...Ch. 1 - YouPolls is a website that allows anyone to create...Ch. 1 - A scholarly article about response rates begins...Ch. 1 - Fifty part-time students were asked how many...Ch. 1 - Sixty adults with gum disease were asked the...Ch. 1 - Nineteen immigrants to the U.S were asked how many...Ch. 1 - How much time does it take to navel to work? Table...Ch. 1 - Forbes magazine published data on the best small...Ch. 1 - Use (he following information o answer the next...Ch. 1 - Use (he following information o answer the next...Ch. 1 - How does sleep deprivation affect your ability to...Ch. 1 - An advertisement for Acme Investments displays the...Ch. 1 - The graph in Figure 1.15 shows the number of...Ch. 1 - Seven hundred and Seventy-one distance learning...Ch. 1 - Several online textbook retailers advertise that...
Additional Math Textbook Solutions
Find more solutions based on key concepts
Use the shell method to find the volumes of the solids generated by revolving the regions bounded by the curves...
University Calculus: Early Transcendentals (4th Edition)
CLT Shapes (Example 4) One of the histograms is a histogram of a sample (from a population with a skewed distri...
Introductory Statistics
Twenty five people, consisting of 15 women and 10 men are lined up in a random order. Find the probability that...
A First Course in Probability (10th Edition)
Conclusions. In Exercises 9–12, refer to the exercise identified. Make subjective estimates to decide whether r...
Elementary Statistics (13th Edition)
TRY IT YOURSELF 1
Find the mean of the points scored by the 51 winning teams listed on page 39.
Elementary Statistics: Picturing the World (7th Edition)
Knowledge Booster


Learn more about
Need a deep-dive on the concept behind this application? Look no further. Learn more about this topic, statistics and related others by exploring similar questions and additional content below.Similar questions
- Why researchers are interested in describing measures of the center and measures of variation of a data set?arrow_forwardWHAT IS THE SOLUTION?arrow_forwardThe following ordered data list shows the data speeds for cell phones used by a telephone company at an airport: A. Calculate the Measures of Central Tendency from the ungrouped data list. B. Group the data in an appropriate frequency table. C. Calculate the Measures of Central Tendency using the table in point B. 0.8 1.4 1.8 1.9 3.2 3.6 4.5 4.5 4.6 6.2 6.5 7.7 7.9 9.9 10.2 10.3 10.9 11.1 11.1 11.6 11.8 12.0 13.1 13.5 13.7 14.1 14.2 14.7 15.0 15.1 15.5 15.8 16.0 17.5 18.2 20.2 21.1 21.5 22.2 22.4 23.1 24.5 25.7 28.5 34.6 38.5 43.0 55.6 71.3 77.8arrow_forward
- II Consider the following data matrix X: X1 X2 0.5 0.4 0.2 0.5 0.5 0.5 10.3 10 10.1 10.4 10.1 10.5 What will the resulting clusters be when using the k-Means method with k = 2. In your own words, explain why this result is indeed expected, i.e. why this clustering minimises the ESS map.arrow_forwardwhy the answer is 3 and 10?arrow_forwardPS 9 Two films are shown on screen A and screen B at a cinema each evening. The numbers of people viewing the films on 12 consecutive evenings are shown in the back-to-back stem-and-leaf diagram. Screen A (12) Screen B (12) 8 037 34 7 6 4 0 534 74 1645678 92 71689 Key: 116|4 represents 61 viewers for A and 64 viewers for B A second stem-and-leaf diagram (with rows of the same width as the previous diagram) is drawn showing the total number of people viewing films at the cinema on each of these 12 evenings. Find the least and greatest possible number of rows that this second diagram could have. TIP On the evening when 30 people viewed films on screen A, there could have been as few as 37 or as many as 79 people viewing films on screen B.arrow_forward
- Q.2.4 There are twelve (12) teams participating in a pub quiz. What is the probability of correctly predicting the top three teams at the end of the competition, in the correct order? Give your final answer as a fraction in its simplest form.arrow_forwardThe table below indicates the number of years of experience of a sample of employees who work on a particular production line and the corresponding number of units of a good that each employee produced last month. Years of Experience (x) Number of Goods (y) 11 63 5 57 1 48 4 54 5 45 3 51 Q.1.1 By completing the table below and then applying the relevant formulae, determine the line of best fit for this bivariate data set. Do NOT change the units for the variables. X y X2 xy Ex= Ey= EX2 EXY= Q.1.2 Estimate the number of units of the good that would have been produced last month by an employee with 8 years of experience. Q.1.3 Using your calculator, determine the coefficient of correlation for the data set. Interpret your answer. Q.1.4 Compute the coefficient of determination for the data set. Interpret your answer.arrow_forwardCan you answer this question for mearrow_forward
- Techniques QUAT6221 2025 PT B... TM Tabudi Maphoru Activities Assessments Class Progress lIE Library • Help v The table below shows the prices (R) and quantities (kg) of rice, meat and potatoes items bought during 2013 and 2014: 2013 2014 P1Qo PoQo Q1Po P1Q1 Price Ро Quantity Qo Price P1 Quantity Q1 Rice 7 80 6 70 480 560 490 420 Meat 30 50 35 60 1 750 1 500 1 800 2 100 Potatoes 3 100 3 100 300 300 300 300 TOTAL 40 230 44 230 2 530 2 360 2 590 2 820 Instructions: 1 Corall dawn to tha bottom of thir ceraan urina se se tha haca nariad in archerca antarand cubmit Q Search ENG US 口X 2025/05arrow_forwardThe table below indicates the number of years of experience of a sample of employees who work on a particular production line and the corresponding number of units of a good that each employee produced last month. Years of Experience (x) Number of Goods (y) 11 63 5 57 1 48 4 54 45 3 51 Q.1.1 By completing the table below and then applying the relevant formulae, determine the line of best fit for this bivariate data set. Do NOT change the units for the variables. X y X2 xy Ex= Ey= EX2 EXY= Q.1.2 Estimate the number of units of the good that would have been produced last month by an employee with 8 years of experience. Q.1.3 Using your calculator, determine the coefficient of correlation for the data set. Interpret your answer. Q.1.4 Compute the coefficient of determination for the data set. Interpret your answer.arrow_forwardQ.3.2 A sample of consumers was asked to name their favourite fruit. The results regarding the popularity of the different fruits are given in the following table. Type of Fruit Number of Consumers Banana 25 Apple 20 Orange 5 TOTAL 50 Draw a bar chart to graphically illustrate the results given in the table.arrow_forward
arrow_back_ios
SEE MORE QUESTIONS
arrow_forward_ios
Recommended textbooks for you
 Holt Mcdougal Larson Pre-algebra: Student Edition...AlgebraISBN:9780547587776Author:HOLT MCDOUGALPublisher:HOLT MCDOUGAL
 Glencoe Algebra 1, Student Edition, 9780079039897...AlgebraISBN:9780079039897Author:CarterPublisher:McGraw Hill
 Big Ideas Math A Bridge To Success Algebra 1: Stu...AlgebraISBN:9781680331141Author:HOUGHTON MIFFLIN HARCOURTPublisher:Houghton Mifflin Harcourt

 College Algebra (MindTap Course List)AlgebraISBN:9781305652231Author:R. David Gustafson, Jeff HughesPublisher:Cengage Learning
Holt Mcdougal Larson Pre-algebra: Student Edition...
Algebra
ISBN:9780547587776
Author:HOLT MCDOUGAL
Publisher:HOLT MCDOUGAL
Glencoe Algebra 1, Student Edition, 9780079039897...
Algebra
ISBN:9780079039897
Author:Carter
Publisher:McGraw Hill
Big Ideas Math A Bridge To Success Algebra 1: Stu...
Algebra
ISBN:9781680331141
Author:HOUGHTON MIFFLIN HARCOURT
Publisher:Houghton Mifflin Harcourt
College Algebra (MindTap Course List)
Algebra
ISBN:9781305652231
Author:R. David Gustafson, Jeff Hughes
Publisher:Cengage Learning
Hypothesis Testing using Confidence Interval Approach; Author: BUM2413 Applied Statistics UMP;https://www.youtube.com/watch?v=Hq1l3e9pLyY;License: Standard YouTube License, CC-BY
Hypothesis Testing - Difference of Two Means - Student's -Distribution & Normal Distribution; Author: The Organic Chemistry Tutor;https://www.youtube.com/watch?v=UcZwyzwWU7o;License: Standard Youtube License