
Introductory Statistics
1st Edition
ISBN: 9781938168208
Author: Barbara Illowsky, Susan Dean
Publisher: OpenStax College
expand_more
expand_more
format_list_bulleted
Concept explainers
Videos
Textbook Question
Chapter 1, Problem 86H
Use (he following information o answer the next two exercises: Table 1.38 contains data on hurricanes that have made direct hits on the U.S. Between 1831 and 2004. A hurricane is given a strength category rating based on the minimum wind speed generated by the storm.
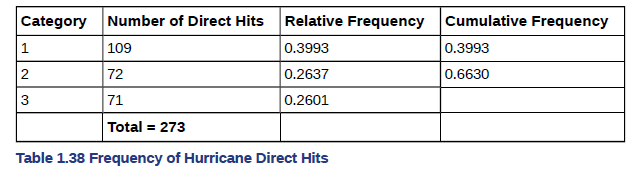
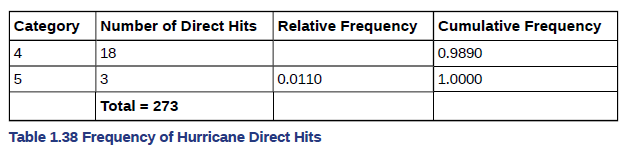
86. What is the relative frequency of direct hits that were AT MOST a category 3 storm?
a. 0.3480
b. 0.9231
c. 0.2601
d. 0.3370
Expert Solution & Answer

Trending nowThis is a popular solution!

Students have asked these similar questions
Business
https://www.hawkeslearning.com/Statistics/dbs2/datasets.html
NC Current Students - North Ce X | NC Canvas Login Links - North ( X
Final Exam Comprehensive x Cengage Learning
x
WASTAT - Final Exam - STAT
→
C
webassign.net/web/Student/Assignment-Responses/submit?dep=36055360&tags=autosave#question3659890_9
Part (b)
Draw a scatter plot of the ordered pairs.
N
Life
Expectancy
Life
Expectancy
80
70
600
50
40
30
20
10
Year of
1950
1970 1990
2010 Birth
O
Life
Expectancy
Part (c)
800
70
60
50
40
30
20
10
1950
1970 1990
W
ALT
林
$
#
4
R
J7
Year of
2010 Birth
F6
4+
80
70
60
50
40
30
20
10
Year of
1950 1970 1990
2010 Birth
Life
Expectancy
Ox
800
70
60
50
40
30
20
10
Year of
1950 1970 1990 2010 Birth
hp
P.B.
KA
&
7
80
% 5
H
A
B
F10
711
N
M
K
744
PRT SC
ALT
CTRL
Chapter 1 Solutions
Introductory Statistics
Ch. 1 - Determine what the key terms refer to in the...Ch. 1 - The data are the number of machines in a gym. You...Ch. 1 - The data are the areas of Lawns in square feet....Ch. 1 - The data are the colors of houses. You sample five...Ch. 1 - Determine the correct data type (quantitative or...Ch. 1 - The registrar at State University keeps records of...Ch. 1 - You are going to use the random number generator...Ch. 1 - Determine the type of sampling used (simple...Ch. 1 - A local radio station has a fan base of 20,000...Ch. 1 - Table 1.13 shows the amount, in inches, of annual...
Ch. 1 - From Table 1.13, find the percentage of rainfall...Ch. 1 - From Table 1.13, find the number of towns that...Ch. 1 - Table 1.13 represents the amount, in inches, of...Ch. 1 - Table 1.16 contains the total number of fatal...Ch. 1 - You are concerned about the effects of texting on...Ch. 1 - Describe the unethical behavior, if any, in each...Ch. 1 - Determine that the key terms refer to in the...Ch. 1 - Determine that the key terms refer to in the...Ch. 1 - Determine that the key terms refer to in the...Ch. 1 - Determine that the key terms refer to in the...Ch. 1 - Determine that the key terms refer to in the...Ch. 1 - “Number of times per week” Is what type of data?...Ch. 1 - The sampling method was a. simple random; b....Ch. 1 - “Duration (amount of time)” is what type of data?...Ch. 1 - The colors of the houses around the park are what...Ch. 1 - The population is ________Ch. 1 - Table 1.26 contains the total number of deaths...Ch. 1 - For the f1onwing four exercises, determine the...Ch. 1 - For the f1onwing four exercises, determine the...Ch. 1 - For the f1onwing four exercises, determine the...Ch. 1 - For the f1onwing four exercises, determine the...Ch. 1 - Use the following information to answer the next...Ch. 1 - Use the following information to answer the next...Ch. 1 - Use the following information to answer the next...Ch. 1 - Use the following information to answer the next...Ch. 1 - Use the following information to answer the next...Ch. 1 - Use the following information to answer the next...Ch. 1 - Use the following information to answer the next...Ch. 1 - Use the following information to answer the next...Ch. 1 - Use the following data to answer the next five...Ch. 1 - Use the following data to answer the next five...Ch. 1 - Use the following data to answer the next five...Ch. 1 - Use the following data to answer the next five...Ch. 1 - Use the following data to answer the next five...Ch. 1 - Use the following data to answer the next five...Ch. 1 - Use the following data to answer the next five...Ch. 1 - Use the following data to answer the next five...Ch. 1 - Use the following data to answer the next five...Ch. 1 - Use the following data to answer the next five...Ch. 1 - Is a sample size of 1,000 a reliable measure for a...Ch. 1 - Is a sample of 500 volunteers a reliable measure...Ch. 1 - A question on a survey reads: “Do you prefer the...Ch. 1 - Is a sample size of two representative of a...Ch. 1 - Is it possible for two experiments to be well run...Ch. 1 - What type of measure scale is being used? Nominal,...Ch. 1 - Design an experiment. Identify the explanatory and...Ch. 1 - Discuss potential violations of the rule requiring...Ch. 1 - For each of the following eight exercises,...Ch. 1 - For each of the following eight exercises,...Ch. 1 - For each of the following eight exercises,...Ch. 1 - For each of the following eight exercises,...Ch. 1 - For each of the following eight exercises,...Ch. 1 - For each of the following eight exercises,...Ch. 1 - For each of the following eight exercises,...Ch. 1 - For each of the following eight exercises,...Ch. 1 - Use the following information to answer the next...Ch. 1 - Use the following information to answer the next...Ch. 1 - Use the following information to answer the next...Ch. 1 - For the following exercises, identify (he type of...Ch. 1 - For the following exercises, identify (he type of...Ch. 1 - For the following exercises, identify (he type of...Ch. 1 - For the following exercises, identify (he type of...Ch. 1 - For the following exercises, identify (he type of...Ch. 1 - For the following exercises, identify (he type of...Ch. 1 - For the following exercises, identify (he type of...Ch. 1 - For the following exercises, identify (he type of...Ch. 1 - For the following exercises, identify (he type of...Ch. 1 - For the following exercises, identify (he type of...Ch. 1 - Use the following information to answer the next...Ch. 1 - Use the following information to answer the next...Ch. 1 - Airline companies are interested in the...Ch. 1 - Suppose you want to determine the mean number of...Ch. 1 - Suppose you want to determine the mean number of...Ch. 1 - List some practical difficulties involved in...Ch. 1 - List some practical difficulties involved in...Ch. 1 - With your classmates, brainstorm some ways you...Ch. 1 - The instructor takes her sample by gathering data...Ch. 1 - A study was done to determine the age, number of...Ch. 1 - Name the sampling method used in each of the...Ch. 1 - A “random survey” was conducted of 3,2’4 people of...Ch. 1 - The Well-Being Index is a survey that follows...Ch. 1 - In advance of the 1936 Presidential Election, a...Ch. 1 - Crime-related and demographic statistics for 4 US...Ch. 1 - YouPolls is a website that allows anyone to create...Ch. 1 - A scholarly article about response rates begins...Ch. 1 - Fifty part-time students were asked how many...Ch. 1 - Sixty adults with gum disease were asked the...Ch. 1 - Nineteen immigrants to the U.S were asked how many...Ch. 1 - How much time does it take to navel to work? Table...Ch. 1 - Forbes magazine published data on the best small...Ch. 1 - Use (he following information o answer the next...Ch. 1 - Use (he following information o answer the next...Ch. 1 - How does sleep deprivation affect your ability to...Ch. 1 - An advertisement for Acme Investments displays the...Ch. 1 - The graph in Figure 1.15 shows the number of...Ch. 1 - Seven hundred and Seventy-one distance learning...Ch. 1 - Several online textbook retailers advertise that...
Additional Math Textbook Solutions
Find more solutions based on key concepts
TRY IT YOURSELF 1
Find the mean of the points scored by the 51 winning teams listed on page 39.
Elementary Statistics: Picturing the World (7th Edition)
Coke versus Pepsi (Example 5) Suppose you are testing someone to see whether she or he can tell Coke from Pepsi...
Introductory Statistics
Finding Critical Values. In Exercises 5–8, find the critical value z?/2 that corresponds to the given confidenc...
Elementary Statistics (13th Edition)
Limits Involving Trigonometric Functions
Find the limits in Exercises 33–40. Are the functions continuous at th...
University Calculus: Early Transcendentals (4th Edition)
The following set of data is from sample of n=5: a. Compute the mean, median, and mode. b. Compute the range, v...
Basic Business Statistics, Student Value Edition
A pair of fair dice is rolled. What is the probability that the second die lands on a higher value than does th...
A First Course in Probability (10th Edition)
Knowledge Booster


Learn more about
Need a deep-dive on the concept behind this application? Look no further. Learn more about this topic, statistics and related others by exploring similar questions and additional content below.Similar questions
- Harvard University California Institute of Technology Massachusetts Institute of Technology Stanford University Princeton University University of Cambridge University of Oxford University of California, Berkeley Imperial College London Yale University University of California, Los Angeles University of Chicago Johns Hopkins University Cornell University ETH Zurich University of Michigan University of Toronto Columbia University University of Pennsylvania Carnegie Mellon University University of Hong Kong University College London University of Washington Duke University Northwestern University University of Tokyo Georgia Institute of Technology Pohang University of Science and Technology University of California, Santa Barbara University of British Columbia University of North Carolina at Chapel Hill University of California, San Diego University of Illinois at Urbana-Champaign National University of Singapore McGill…arrow_forwardName Harvard University California Institute of Technology Massachusetts Institute of Technology Stanford University Princeton University University of Cambridge University of Oxford University of California, Berkeley Imperial College London Yale University University of California, Los Angeles University of Chicago Johns Hopkins University Cornell University ETH Zurich University of Michigan University of Toronto Columbia University University of Pennsylvania Carnegie Mellon University University of Hong Kong University College London University of Washington Duke University Northwestern University University of Tokyo Georgia Institute of Technology Pohang University of Science and Technology University of California, Santa Barbara University of British Columbia University of North Carolina at Chapel Hill University of California, San Diego University of Illinois at Urbana-Champaign National University of Singapore…arrow_forwardA company found that the daily sales revenue of its flagship product follows a normal distribution with a mean of $4500 and a standard deviation of $450. The company defines a "high-sales day" that is, any day with sales exceeding $4800. please provide a step by step on how to get the answers in excel Q: What percentage of days can the company expect to have "high-sales days" or sales greater than $4800? Q: What is the sales revenue threshold for the bottom 10% of days? (please note that 10% refers to the probability/area under bell curve towards the lower tail of bell curve) Provide answers in the yellow cellsarrow_forward
- Find the critical value for a left-tailed test using the F distribution with a 0.025, degrees of freedom in the numerator=12, and degrees of freedom in the denominator = 50. A portion of the table of critical values of the F-distribution is provided. Click the icon to view the partial table of critical values of the F-distribution. What is the critical value? (Round to two decimal places as needed.)arrow_forwardA retail store manager claims that the average daily sales of the store are $1,500. You aim to test whether the actual average daily sales differ significantly from this claimed value. You can provide your answer by inserting a text box and the answer must include: Null hypothesis, Alternative hypothesis, Show answer (output table/summary table), and Conclusion based on the P value. Showing the calculation is a must. If calculation is missing,so please provide a step by step on the answers Numerical answers in the yellow cellsarrow_forwardShow all workarrow_forward
arrow_back_ios
SEE MORE QUESTIONS
arrow_forward_ios
Recommended textbooks for you
 Holt Mcdougal Larson Pre-algebra: Student Edition...AlgebraISBN:9780547587776Author:HOLT MCDOUGALPublisher:HOLT MCDOUGAL
 Glencoe Algebra 1, Student Edition, 9780079039897...AlgebraISBN:9780079039897Author:CarterPublisher:McGraw Hill
 College AlgebraAlgebraISBN:9781305115545Author:James Stewart, Lothar Redlin, Saleem WatsonPublisher:Cengage Learning
 Algebra and Trigonometry (MindTap Course List)AlgebraISBN:9781305071742Author:James Stewart, Lothar Redlin, Saleem WatsonPublisher:Cengage Learning
 Algebra: Structure And Method, Book 1AlgebraISBN:9780395977224Author:Richard G. Brown, Mary P. Dolciani, Robert H. Sorgenfrey, William L. ColePublisher:McDougal Littell
 College Algebra (MindTap Course List)AlgebraISBN:9781305652231Author:R. David Gustafson, Jeff HughesPublisher:Cengage Learning
Holt Mcdougal Larson Pre-algebra: Student Edition...
Algebra
ISBN:9780547587776
Author:HOLT MCDOUGAL
Publisher:HOLT MCDOUGAL
Glencoe Algebra 1, Student Edition, 9780079039897...
Algebra
ISBN:9780079039897
Author:Carter
Publisher:McGraw Hill
College Algebra
Algebra
ISBN:9781305115545
Author:James Stewart, Lothar Redlin, Saleem Watson
Publisher:Cengage Learning
Algebra and Trigonometry (MindTap Course List)
Algebra
ISBN:9781305071742
Author:James Stewart, Lothar Redlin, Saleem Watson
Publisher:Cengage Learning
Algebra: Structure And Method, Book 1
Algebra
ISBN:9780395977224
Author:Richard G. Brown, Mary P. Dolciani, Robert H. Sorgenfrey, William L. Cole
Publisher:McDougal Littell
College Algebra (MindTap Course List)
Algebra
ISBN:9781305652231
Author:R. David Gustafson, Jeff Hughes
Publisher:Cengage Learning
Bayes' Theorem 1: Introduction and conditional probability; Author: Dr Nic's Maths and Stats;https://www.youtube.com/watch?v=lQVkXfJ-rpU;License: Standard YouTube License, CC-BY
What is Conditional Probability | Bayes Theorem | Conditional Probability Examples & Problems; Author: ACADGILD;https://www.youtube.com/watch?v=MxOny_1y2Q4;License: Standard YouTube License, CC-BY
Bayes' Theorem of Probability With Tree Diagrams & Venn Diagrams; Author: The Organic Chemistry Tutor;https://www.youtube.com/watch?v=OByl4RJxnKA;License: Standard YouTube License, CC-BY
Bayes' Theorem - The Simplest Case; Author: Dr. Trefor Bazett;https://www.youtube.com/watch?v=XQoLVl31ZfQ;License: Standard Youtube License