Table 1.16 contains the total number of fatal motor vehicle traffic crashes in the United States for the period from 1994 to 2011. Table 1.16 Answer the following questions. a. What is the frequency of deaths measured from 2000 throug1 2004? b. What percentage of deaths occurred after 2006? c. What is the relative frequency of deaths that occurred in 2000 or before? d. What is the percentage of deaths that occurred in 2011? e. What is the cumulative relative frequency for 2006? Explain what this number tells you about the data.
Table 1.16 contains the total number of fatal motor vehicle traffic crashes in the United States for the period from 1994 to 2011. Table 1.16 Answer the following questions. a. What is the frequency of deaths measured from 2000 throug1 2004? b. What percentage of deaths occurred after 2006? c. What is the relative frequency of deaths that occurred in 2000 or before? d. What is the percentage of deaths that occurred in 2011? e. What is the cumulative relative frequency for 2006? Explain what this number tells you about the data.
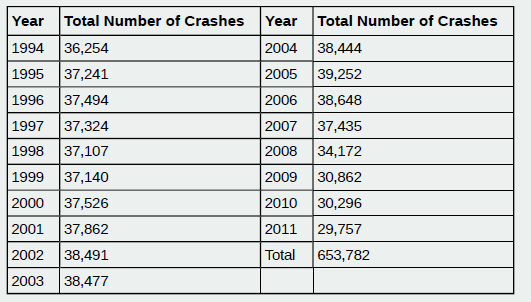
Table 1.16 contains the total number of fatal motor vehicle traffic crashes in the United States for the period from 1994 to 2011.
Table 1.16
Answer the following questions. a. What is the frequency of deaths measured from 2000 throug1 2004? b. What percentage of deaths occurred after 2006? c. What is the relative frequency of deaths that occurred in 2000 or before? d. What is the percentage of deaths that occurred in 2011? e. What is the cumulative relative frequency for 2006? Explain what this number tells you about the data.
NC Current Students - North Ce X | NC Canvas Login Links - North ( X
Final Exam Comprehensive x Cengage Learning
x
WASTAT - Final Exam - STAT
→
C
webassign.net/web/Student/Assignment-Responses/submit?dep=36055360&tags=autosave#question3659890_9
Part (b)
Draw a scatter plot of the ordered pairs.
N
Life
Expectancy
Life
Expectancy
80
70
600
50
40
30
20
10
Year of
1950
1970 1990
2010 Birth
O
Life
Expectancy
Part (c)
800
70
60
50
40
30
20
10
1950
1970 1990
W
ALT
林
$
#
4
R
J7
Year of
2010 Birth
F6
4+
80
70
60
50
40
30
20
10
Year of
1950 1970 1990
2010 Birth
Life
Expectancy
Ox
800
70
60
50
40
30
20
10
Year of
1950 1970 1990 2010 Birth
hp
P.B.
KA
&
7
80
% 5
H
A
B
F10
711
N
M
K
744
PRT SC
ALT
CTRL
Harvard University
California Institute of Technology
Massachusetts Institute of Technology
Stanford University
Princeton University
University of Cambridge
University of Oxford
University of California, Berkeley
Imperial College London
Yale University
University of California, Los Angeles
University of Chicago
Johns Hopkins University
Cornell University
ETH Zurich
University of Michigan
University of Toronto
Columbia University
University of Pennsylvania
Carnegie Mellon University
University of Hong Kong
University College London
University of Washington
Duke University
Northwestern University
University of Tokyo
Georgia Institute of Technology
Pohang University of Science and Technology
University of California, Santa Barbara
University of British Columbia
University of North Carolina at Chapel Hill
University of California, San Diego
University of Illinois at Urbana-Champaign
National University of Singapore
McGill…
Name
Harvard University
California Institute of Technology
Massachusetts Institute of Technology
Stanford University
Princeton University
University of Cambridge
University of Oxford
University of California, Berkeley
Imperial College London
Yale University
University of California, Los Angeles
University of Chicago
Johns Hopkins University
Cornell University
ETH Zurich
University of Michigan
University of Toronto
Columbia University
University of Pennsylvania
Carnegie Mellon University
University of Hong Kong
University College London
University of Washington
Duke University
Northwestern University
University of Tokyo
Georgia Institute of Technology
Pohang University of Science and Technology
University of California, Santa Barbara
University of British Columbia
University of North Carolina at Chapel Hill
University of California, San Diego
University of Illinois at Urbana-Champaign
National University of Singapore…
Need a deep-dive on the concept behind this application? Look no further. Learn more about this topic, statistics and related others by exploring similar questions and additional content below.
Compound Interest Formula Explained, Investment, Monthly & Continuously, Word Problems, Algebra; Author: The Organic Chemistry Tutor;https://www.youtube.com/watch?v=P182Abv3fOk;License: Standard YouTube License, CC-BY
Applications of Algebra (Digit, Age, Work, Clock, Mixture and Rate Problems); Author: EngineerProf PH;https://www.youtube.com/watch?v=Y8aJ_wYCS2g;License: Standard YouTube License, CC-BY


 College Algebra (MindTap Course List)AlgebraISBN:9781305652231Author:R. David Gustafson, Jeff HughesPublisher:Cengage Learning
 Holt Mcdougal Larson Pre-algebra: Student Edition...AlgebraISBN:9780547587776Author:HOLT MCDOUGALPublisher:HOLT MCDOUGAL
 Glencoe Algebra 1, Student Edition, 9780079039897...AlgebraISBN:9780079039897Author:CarterPublisher:McGraw Hill
 Big Ideas Math A Bridge To Success Algebra 1: Stu...AlgebraISBN:9781680331141Author:HOUGHTON MIFFLIN HARCOURTPublisher:Houghton Mifflin Harcourt
 Algebra: Structure And Method, Book 1AlgebraISBN:9780395977224Author:Richard G. Brown, Mary P. Dolciani, Robert H. Sorgenfrey, William L. ColePublisher:McDougal Littell
 Functions and Change: A Modeling Approach to Coll...AlgebraISBN:9781337111348Author:Bruce Crauder, Benny Evans, Alan NoellPublisher:Cengage Learning