Forbes magazine published data on the best small firms in 2012. These were firms which had been publicly traded for at least a year. have a stock price of at least S3 per share, and have reported annual revenue between $3 million and $1 billion. Table 1.37 shows the ages of the chief executive officers for the first 60 ranked firms. Table 1.37 a. What is the frequency for CEO ages between 34 and 63? b. What percentage of CEOs are 63 years or older? c. What is the relative frequency of ages under 30? d. What is the cumulative relative frequency for CEOs younger than 55? e. Which graph shows the relative frequency and which shows the cumulative relative frequency? Figure 1.13
Forbes magazine published data on the best small firms in 2012. These were firms which had been publicly traded for at least a year. have a stock price of at least S3 per share, and have reported annual revenue between $3 million and $1 billion. Table 1.37 shows the ages of the chief executive officers for the first 60 ranked firms. Table 1.37 a. What is the frequency for CEO ages between 34 and 63? b. What percentage of CEOs are 63 years or older? c. What is the relative frequency of ages under 30? d. What is the cumulative relative frequency for CEOs younger than 55? e. Which graph shows the relative frequency and which shows the cumulative relative frequency? Figure 1.13
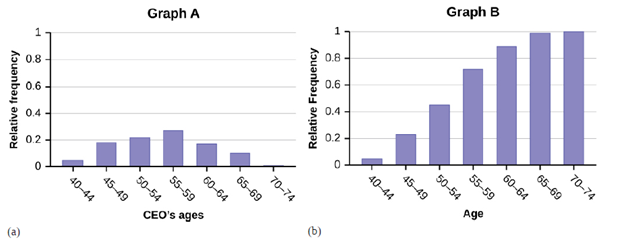
Forbes magazine published data on the best small firms in 2012. These were firms which had been publicly traded for at least a year. have a stock price of at least S3 per share, and have reported annual revenue between $3 million and $1 billion. Table 1.37 shows the ages of the chief executive officers for the first 60 ranked firms.
Table 1.37
a. What is the frequency for CEO ages between 34 and 63?
b. What percentage of CEOs are 63 years or older?
c. What is the relative frequency of ages under 30?
d. What is the cumulative relative frequency for CEOs younger than 55?
e. Which graph shows the relative frequency and which shows the cumulative relative frequency?
NC Current Students - North Ce X | NC Canvas Login Links - North ( X
Final Exam Comprehensive x Cengage Learning
x
WASTAT - Final Exam - STAT
→
C
webassign.net/web/Student/Assignment-Responses/submit?dep=36055360&tags=autosave#question3659890_9
Part (b)
Draw a scatter plot of the ordered pairs.
N
Life
Expectancy
Life
Expectancy
80
70
600
50
40
30
20
10
Year of
1950
1970 1990
2010 Birth
O
Life
Expectancy
Part (c)
800
70
60
50
40
30
20
10
1950
1970 1990
W
ALT
林
$
#
4
R
J7
Year of
2010 Birth
F6
4+
80
70
60
50
40
30
20
10
Year of
1950 1970 1990
2010 Birth
Life
Expectancy
Ox
800
70
60
50
40
30
20
10
Year of
1950 1970 1990 2010 Birth
hp
P.B.
KA
&
7
80
% 5
H
A
B
F10
711
N
M
K
744
PRT SC
ALT
CTRL
Elementary Statistics: Picturing the World (7th Edition)
Knowledge Booster
Learn more about
Need a deep-dive on the concept behind this application? Look no further. Learn more about this topic, statistics and related others by exploring similar questions and additional content below.


 Glencoe Algebra 1, Student Edition, 9780079039897...AlgebraISBN:9780079039897Author:CarterPublisher:McGraw Hill
 Big Ideas Math A Bridge To Success Algebra 1: Stu...AlgebraISBN:9781680331141Author:HOUGHTON MIFFLIN HARCOURTPublisher:Houghton Mifflin Harcourt
 Holt Mcdougal Larson Pre-algebra: Student Edition...AlgebraISBN:9780547587776Author:HOLT MCDOUGALPublisher:HOLT MCDOUGAL
 Algebra: Structure And Method, Book 1AlgebraISBN:9780395977224Author:Richard G. Brown, Mary P. Dolciani, Robert H. Sorgenfrey, William L. ColePublisher:McDougal Littell