
Videos
Nike: Somewhere between a Swoosh and a Slam Dunk
Nike, Inc.’s principal business activity involves the design, development, and worldwide marketing of high-quality footwear, apparel, equipment, and accessory products for serious and recreational athletes. Almost 25,000 employees work for the firm as of 2009. Nike boasts the largest worldwide market share in the athletic footwear industry and a leading market share in sports and athletic apparel.
This case uses Nike’s financial statements and excerpts from its notes to review important concepts underlying the three principal financial statements (
Industry Economics
Product Lines
Industry analysts debate whether the athletic footwear and apparel industry is a performancedriven industry or a fashion-driven industry. Proponents of the performance view point to Nike’s dominant market position, which results in part from continual innovation in product development. Proponents of the fashion view point to the difficulty of protecting technological improvements from competitor imitation, the large portion of total expenses comprising advertising, the role of sports and other personalities in promoting athletic shoes, and the fact that a high percentage of athletic footwear and apparel consumers use the products for casual wear rather than the intended athletic purposes (such as playing basketball or running).
Growth
There are only modest growth opportunities for footwear and apparel in the United States. Concern exists with respect to volume increases (how many pairs of athletic shoes will consumers tolerate in their closets) and price increases (will consumers continue to pay prices for innovative athletic footwear that is often twice as costly as other footwear).
Athletic footwear companies have diversified their revenue sources in two directions in recent years. One direction involves increased emphasis on international sales. With dress codes becoming more casual in Europe and East Asia and interest in American sports such as basketball becoming more widespread, industry analysts view international markets as the major growth markets during the next several years. Increased emphasis on soccer (European football) in the United States aids companies such as Adidas that have reputations for quality soccer footwear.
The second direction for diversification is sports and athletic apparel. The three leading athletic footwear companies capitalize on their brand name recognition and distribution channels to create a line of sportswear that coordinates with their footwear. Team uniforms and matching apparel for coaching staffs and fans have become a major growth avenue. For example, to complement Nike’s footwear sales, Nike acquired Umbro, a major brand-name line of jerseys, shorts, jackets, and other apparel in the soccer market.
Production
Essentially all athletic footwear and most apparel are produced in factories in Asia, primarily China (40%), Indonesia (31%), Vietnam, South Korea, Taiwan, and Thailand. The footwear companies do not own any of these manufacturing facilities. They typically hire manufacturing representatives to source and oversee the manufacturing process, helping to ensure quality control and serving as a link between the design and the manufacture of products. The manufacturing process is labor-intensive, with sewing machines used as the primary equipment. Footwear companies typically price their purchases from these factories in U.S. dollars.
Marketing
Athletic footwear and sportswear companies sell their products to consumers through various independent department, specialty, and discount stores. Their sales forces educate retailers on new product innovations, store display design, and similar activities. The market shares of Nike and the other major brand-name producers dominate retailers’ shelf space, and slower growth in sales makes it increasingly difficult for the remaining athletic footwear companies to gain market share. The slower growth also has led the major companies to increase significantly their advertising and payments for celebrity endorsements. Many footwear companies, including Nike, have opened their own retail stores, as well as factory outlet stores for discounted sales of excess inventory.
Athletic footwear and sportswear companies have typically used independent distributors to market their products in other countries. With increasing brand recognition and anticipated growth in international sales, these companies have recently acquired an increasing number of their distributors to capture more of the profits generated in other countries and maintain better control of international marketing.
Financing
Compared to other apparel firms, the athletic footwear firms generate higher profit margins and
Nike Strategy
Nike targets the serious athlete with performance-driven footwear and athletic wear, as well as the recreational athlete. The firm has steadily expanded the scope of its product portfolio from its primary products of high-quality athletic footwear for running, training, basketball, soccer, and casual wear to encompass related product lines such as sports apparel, bags, equipment, balls, eyewear, timepieces, and other athletic accessories. In addition, Nike has expanded its scope of sports, now offering products for swimming, baseball, cheerleading, football, golf, lacrosse, tennis, volleyball, skateboarding, and other leisure activities. In recent years, the firm has emphasized growth outside the United States. Nike also has grown by acquiring other apparel companies, including Cole Haan (dress and casual footwear), Converse (athletic and casual footwear and apparel), Hurley (apparel for action sports such as surfing, skateboarding, and snowboarding), and Umbro (footwear, apparel, and equipment for soccer). The firm sums up the company’s philosophy and driving force behind its success as follows:
Nike designs, develops, and markets high quality footwear, apparel, equipment and accessory products worldwide. We are the largest seller of athletic footwear and apparel in the world. Our strategy is to achieve long-term revenue growth by creating innovative, “must-have” products; building deep, personal consumer connections with our brands; and delivering compelling retail presentation and experiences.
To maintain its technological edge, Nike engages in extensive research at its research facilities in Beaverton, Oregon. It continually alters its product line to introduce new footwear, apparel, equipment, and evolutionary improvements in existing products.
Nike maintains a reputation for timely delivery of footwear products to its customers, primarily as a result of its “Futures” ordering program. Under this program, retailers book orders five to six months in advance. Nike guarantees delivery of the order within a set time period at the agreed price at the time of ordering. Approximately 89% of the U.S. footwear orders received by Nike during 2009 came through its Futures program. This program allows the company to improve production scheduling, thereby reducing inventory risk. However, the program locks in selling prices and increases Nike’s risk of increased raw materials and labor costs. Independent contractors manufacture virtually all of Nike’s products. Nike sources all of its footwear and approximately 95% of its apparel from other countries.
The following exhibits present information for Nike:
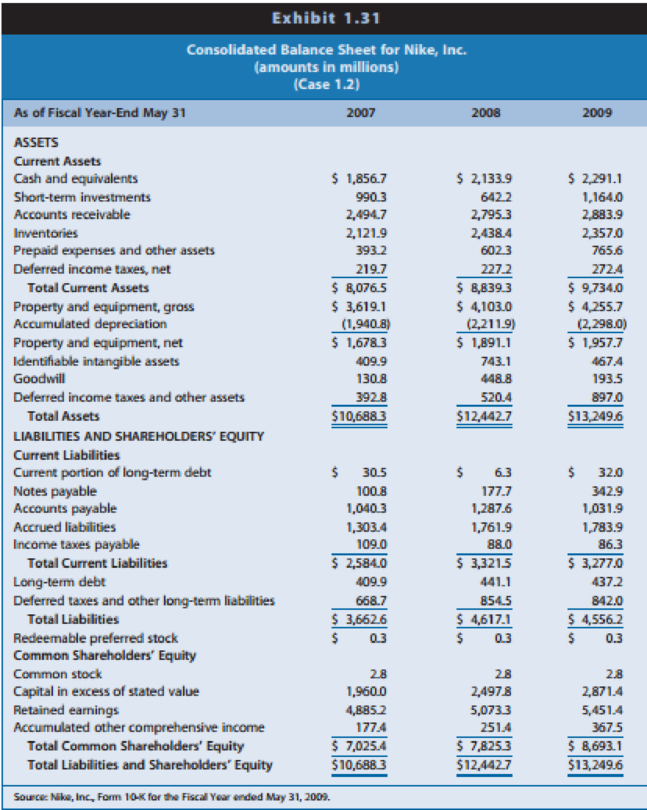
Exhibit 1.31: Consolidated balance sheets for 2007, 2008, and 2009
Exhibit 1.32: Consolidated income statements for 2007,2008, and 2009
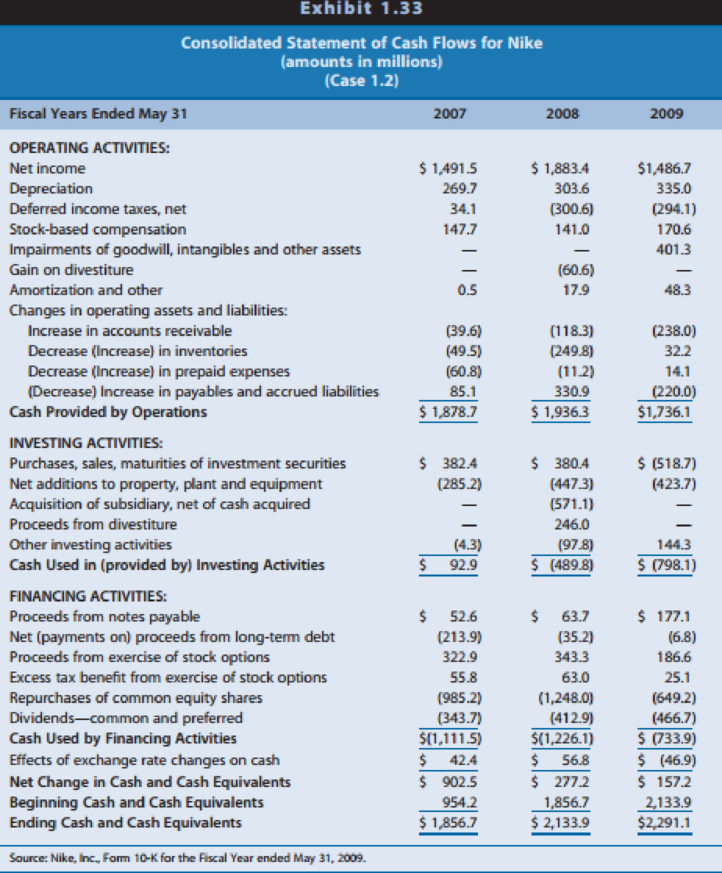
Exhibit 1.33: Consolidated statements of cash flows 2007, 2008, and 2009
Exhibit 1.34: Excerpts from the notes to Nike’s financial statements
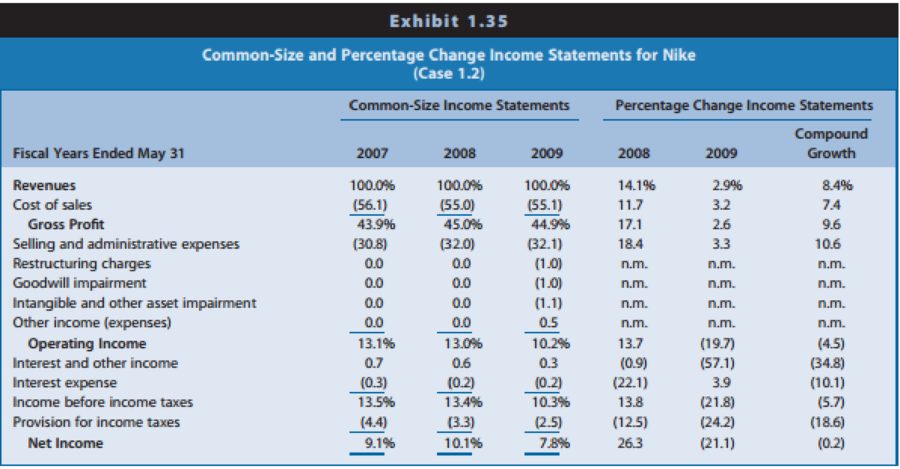
Exhibit 1.35: Common-size and percentage change income statements
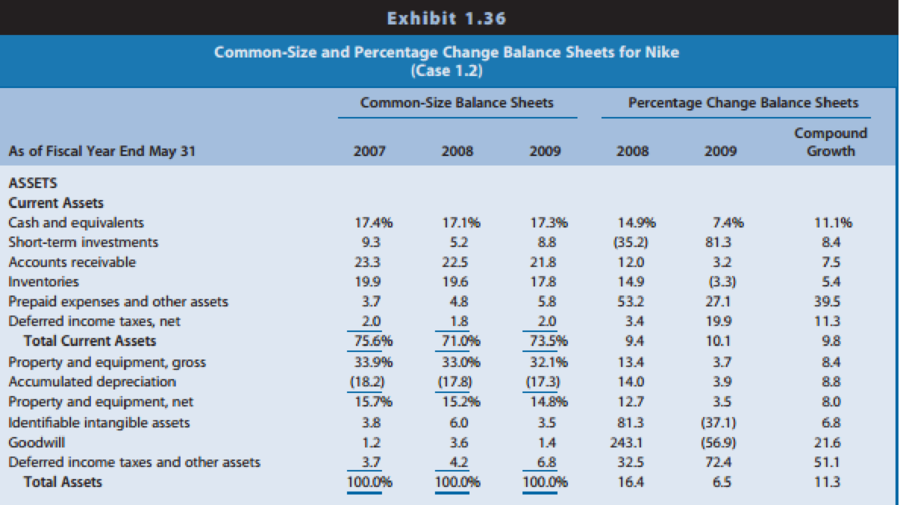
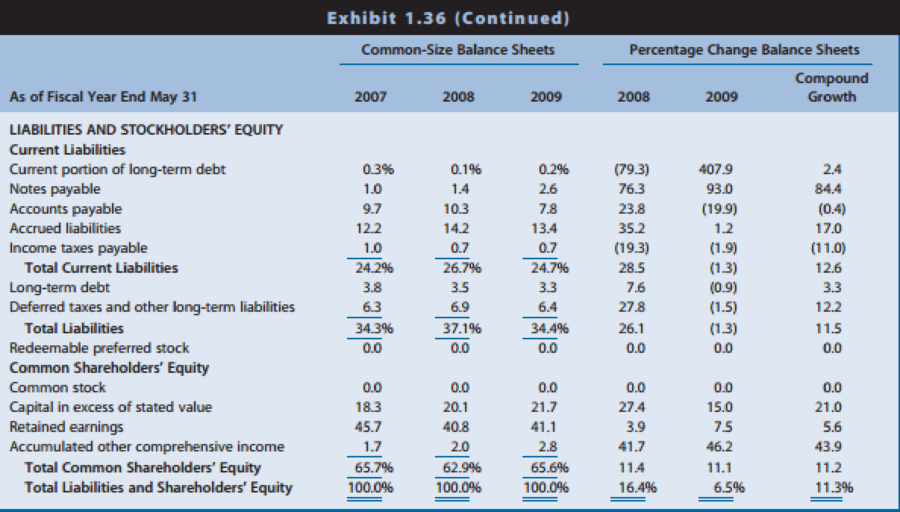
Exhibit 1.36: Common-size and percentage change balance sheets
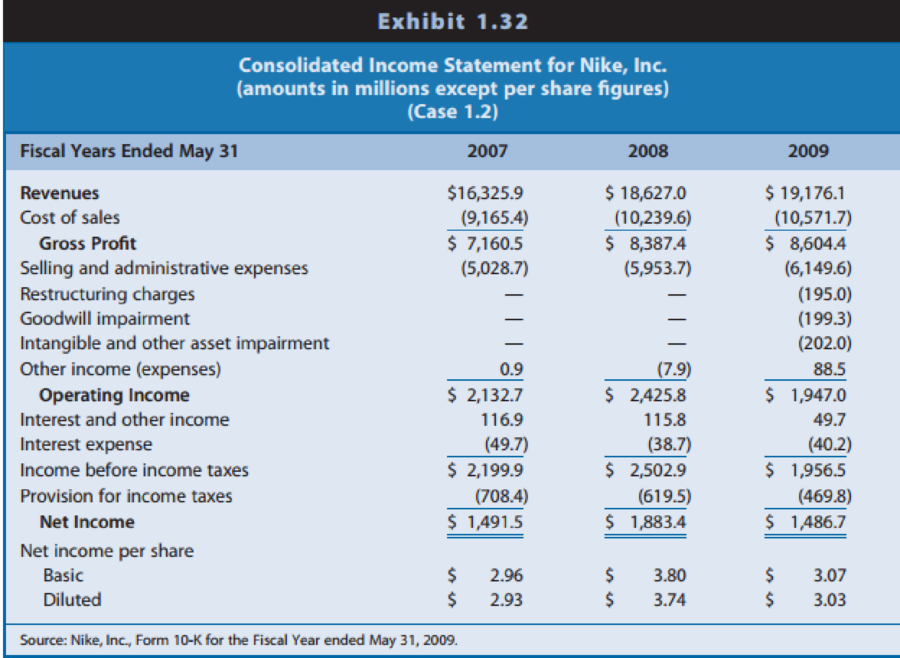
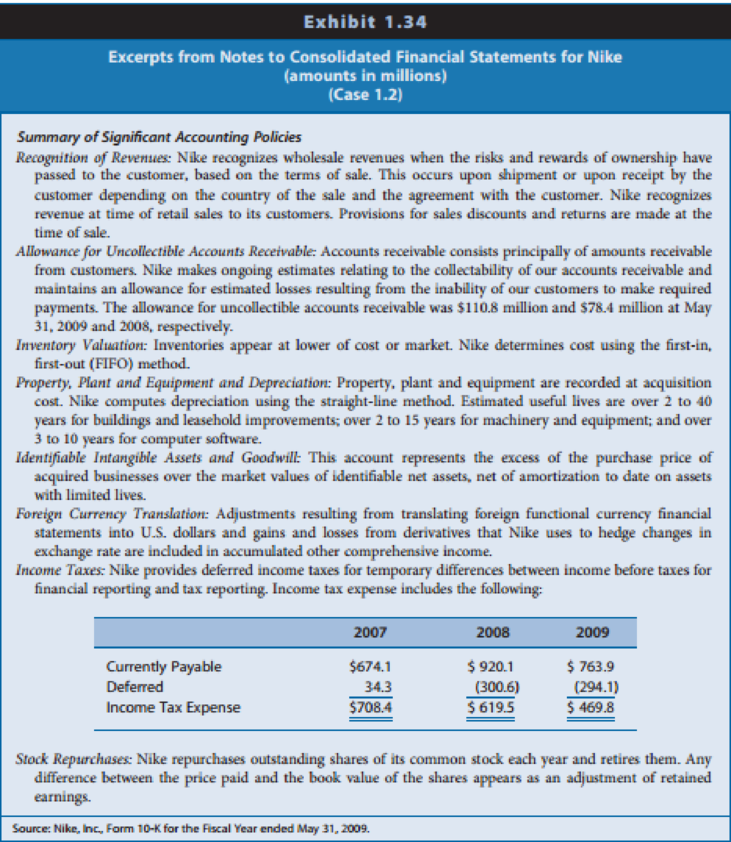
Identify the time at which Nike recognizes revenues. Does this timing of revenue recognition seem appropriate? Explain.
REQUIRED
Study the financial statements and notes for Nike and respond to the following questions.
How has Nike primarily financed its acquisitions of property, plant, and equipment during the three years?
Want to see the full answer?
Check out a sample textbook solution
Chapter 1 Solutions
Financial Reporting, Financial Statement Analysis and Valuation


- < When you purchased your car, you took out a 5-year annual-payment loan with an interest rate of 5% per year. The annual payment on the car is $5,200. You have just made a payment and have now decided to pay off the loan by repaying the outstanding balance. What is the payoff amount for the following scenarios? a. You have owned the car for 1 year (so there are 4 years left on the loan)? b. You have owned the car for 4 years (so there is 1 year left on the loan)? a. You have owned the car for 1 year (so there are 4 years left on the loan)? The payoff if there are 4 years left on the loan is $ (Round to the nearest cent.) b. You have owned the car for 4 years (so there is 1 year left on the loan)? The payoff if there is 1 year left on the loan is $ (Round to the nearest cent.)arrow_forwardVictoria Exports (Canada). A Canadian exporter, Victoria Exports, will be receiving six payments of €13,800, ranging from now to 12 months in the future. Since the company keeps cash balances in both Canadian dollars and U.S. dollars, it can choose which currency to exchange the euros for at the end of the various periods. Which currency appears to offer the better rates in the forward market? (Click on the icon to import the table into a spreadsheet.) Period Days Forward spot 1 month C$/euro 1.3347 1.3370 US$/euro 1.3219 1.3224 m 2 months 3 months 1.3392 30 60 1.3229 90 1.3235 180 1.3438 12 months 360 1.3464 1.3239 1.3269 6 months 1.3416 Calculate the forward premium, the Canadian dollar proceeds, and the difference from the spot rate proceeds in the C$/Euro forward market below: (Round the forward premium to three decimal places and the Canadian dollar amounts to the nearest cent.) Days Forward Premium C$ Proceeds of Difference Period Forward C$/euro on the C$/euro €13,800 Over Spot…arrow_forwardidentify the primary sources of financing, both traditional and alternative, accessible to companies seeking sources of funding. To do so, you should: Collect and curate data and documentary resources from various sources (magazine articles, newspapers, online content, working papers from various institutions, activity reports, performance reports, legal regulations, speeches, appearances, press conferences, etc.). Analyze the documentary content you have previously curated and collected. During your analysis, consider the context, location, timing, and target audience of the texts. Reference Article: One Park Financial. (2022). Best alternative business loans and financing for entrepreneurs. https://www.oneparkfinancial.com/blog/alternative-business-funding Questions: Identify and summarize the traditional financial avenues available to businesses. What are the most innovative financing options they could find? Open-ended question: if you were in the opposite position, as an…arrow_forward
- XYZ stock price and dividend history are as follows: Beginning-of- $ 130 Dividend Paid at Year Year Price Year-End 2021 $ 2 2022 2023 153 2 2024 128 133 2 2 An investor buys five shares of XYZ at the beginning of 2021, buys another two shares at the beginning of 2022, sells one share at the beginning of 2023, and sells all six remaining shares at the beginning of 2024. Required: a. What are the arithmetic and geometric average time-weighted rates of return for the investor? Note: Do not round intermediate calculations. Round your answers to 2 decimal places. Arithmetic time-weighted average returns Geometric time-weighted average returns % % b-1. Prepare a chart of cash flows for the four dates corresponding to the turns of the year for January 1, 2021, to January 1, 2024. Note: Negative amounts should be indicated by a minus sign. Date 01/01/2021 01/01/2022 Cash Flow 01/01/2023 01/01/2024 b-2. What is the dollar-weighted rate of return? (Hint. If your calculator cannot calculate…arrow_forwardConsider the following two banks: Bank 1 has assets composed solely of a 10-year, 11.50 percent coupon, $1.5 million loan with a 11.50 percent yield to maturity. It is financed with a 10-year, 10 percent coupon, $1.5 million CD with a 10 percent yield to maturity. Bank 2 has assets composed solely of a 7-year, 11.50 percent, zero-coupon bond with a current value of $1,108,283.85 and a maturity value of $2,374,515.87. It is financed with a 10-year, 5.75 percent coupon, $1,500,000 face value CD with a yield to maturity of 10 percent. All securities except the zero-coupon bond pay interest annually. a. If interest rates rise by 1 percent (100 basis points), what is the difference in the value of the assets and liabilities of each bank? Note: Do not round intermediate calculations. Negative amounts should be indicated by a minus sign. Enter the answers in dollars, not millions of dollars. Round your answers to 2 decimal places. (e.g., 32.16) Before Interest Asset Value After Interest…arrow_forwardTIME TO REACH A FINANCIAL GOAL You have $42,180.53 in a brokerage account, and you plan to deposit an additional $5,000 at the end of every future year until your account totals $250,000. You expect to earn 12% annually on the account. How many years will it take to reach your goal? Round UP to the nearest year. (Example 5.01 years = 6 years) Your answer should include numerical value only.arrow_forward
- You plan to retire in 30 years. • In 50 years, you want to give your daughter a $500,000 gift. • You will receive an inheritance of $200,000 in 25 years. • You think you will want $50,000 per year when you retire for 30 years (the first withdrawal will come one year after retirement). • You will begin saving an amount to meet your retirement goals one year from today. Required: • If you think you can make 9% on your investments, how much will you need to save each year for the next 30 years to meet your retirement goals?arrow_forwardAn initial $3300 investment was worth $3820 after two years and six months. What quarterly compounded nominal rate of return did the investment earn? (Do not round intermediate calculations and round your final answer to 2 decimal places.) Nominal rate of return % compounded quarterly.arrow_forwardSuppose your firm is considering investing in a project with the cash flows shown below, that the required rate of return on projects of this risk class is 9 percent, and that the maximum allowable payback and discounted payback statistics for the project are 2.0 and 3.0 years, respectively.arrow_forward
- Please don't use Ai solutionarrow_forwardng Equipment is worth $998,454. It is expected to produce regular cash flows of $78,377 per year for 20 years and a special cash flow of $34,800 in 20 years. The cost of capital is X percent per year and the first regular cash flow will be produced in 1 year. What is X? Input instructions: Input your answer as the number that appears before the percentage sign. For example, enter 9.86 for 9.86% (do not enter .0986 or 9.86%). Round your answer to at least 2 decimal places. percentarrow_forward3 years ago, you invested $6,700. In 5 years, you expect to have $12,201. If you expect to earn the same annual return after 5 years from today as the annual return implied from the past and expected values given in the problem, then in how many years from today do you expect to have $25,254?arrow_forward
 Financial And Managerial AccountingAccountingISBN:9781337902663Author:WARREN, Carl S.Publisher:Cengage Learning,
 Century 21 Accounting Multicolumn JournalAccountingISBN:9781337679503Author:GilbertsonPublisher:Cengage
 Auditing: A Risk Based-Approach to Conducting a Q...AccountingISBN:9781305080577Author:Karla M Johnstone, Audrey A. Gramling, Larry E. RittenbergPublisher:South-Western College PubPrinciples of Accounting Volume 2AccountingISBN:9781947172609Author:OpenStaxPublisher:OpenStax College
 Managerial AccountingAccountingISBN:9781337912020Author:Carl Warren, Ph.d. Cma William B. TaylerPublisher:South-Western College Pub